

There seems to be fairly wide consensus that the modern practice of scheduling is not delivering the results needed to help projects succeed.
My feeling is that with a few notable exceptions the underpinning ideas of the Critical Path Method (CPM) of scheduling developed in the 1950s and 60s have been forgotten and most software and most scheduling practice uses ideas from the 18th century.
The concept of Bar Charts was developed in the 18th century (or possibly earlier). Joseph Priestley (1733-1804) published his ‘Chart of Biography’:

He is quoted as saying “…a longer or a shorter space of time may be most commodiously and advantageously represented by a longer or a shorter line.”
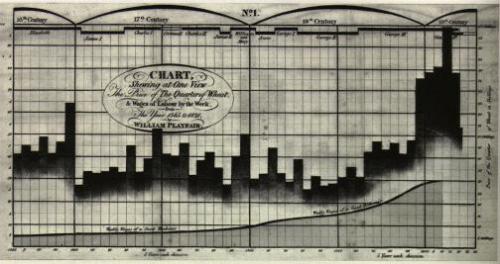
A few years later a full range of modern charts were published by William Playfair (1759-1823) in his ‘Commercial and Political Atlas’ of 1786:
By the end of the 19th century sophisticated barcharts appear to have been in general use (at least in Europe – the project below was built in 1910):

For more on the early development of scheduling see A Brief History of Scheduling.
Henry Gantt developed his production management systems for factories in the early part of the 20th century with a range of charts designed as production monitoring and control tools:

Importantly Gantt did not use simple bar charts and had no interest in one-off projects. He was focused on machine shop efficiency and production quotas:

For more on his work see: Henry L. Gantt – A Retrospective view of his work.
CPM and PERT were invented in 1957 as computer based analytic models:

Importantly, in both systems, planning the logic and entering the information into the computer precedes calculating the schedule. Both CPM and PERT used ADM networks:

The ‘precedence diagram’ (PDM) network was published in 1961 as a simplified manual process to make CPM available to people without access to expensive mainframe computer time – in the PDM system as published drawing the logic diagram also precedes calculating the schedule.

There is no question CPM offered significant advantages over the traditional bar charts that had been in use for more that 100 years. In my view, the major advance that generated the improved project outcomes was the need to think through the work logically, focusing on the activities and sequence of work before any attempt to schedule the project was possible. This was equally true of both the mainframe systems and the manual systems in use through the 1960s and 70s. James Kelley (co-inventor of CPM) had a very similar view.
The same concept of good practice is embedded in the PMBOK® Guide. The separate processes in the 5th Edition are:
6.1 – Plan schedule
6.2 – Define Activities
6.3 – Sequence Activities
6.4 – Estimate Resources
6.5 – Estimate Durations
6.6 – Develop Schedule
6.7 – Control Schedule
CPM was recognised as an improvement on bar chart planning! So my question is: If CPM scheduling is supposed to be a logical process why do so many scheduling tools default to, and planners work from, 250 year old Bar Charts? Is this the cause of scheduling failures?
There are tools around that default to creating the schedule logic in a network diagram but they are in the minority. I will be discussing one of these at the Construction CPM conference in New Orleans later this month (see: http://www.constructioncpm.com/). Micro Planner X-Pert is a true CPM System that supports the PMBOK® Guide schedule development process:

And lets you chose the networking style PDM or ADM:

For more on Micro Planner see: http://www.microplanning.com.au/
But back to the key question, is scheduling failing through lack of skills and training, a lack of knowledge, poor techniques focused on 250 year old bar charts or some other reason?
The 15,000 articles a month downloaded from our planning resource page, suggest a strong interest in planning and scheduling but this interest does not seem to be reflected in the status or planners or project outcomes. I look forward to the discussions….
