Monday

Tag Archives: History of Project Management

The Origins of Military Engineers

Military engineers have been a part of an Army for millennia. But until relatively recent times, the engineer was an individual who directed the work of troops, or civilian contractors. The military engineer may be an officer or may be simply a skilled civilian working for the State or military.

The shift to army’s employing skilled people in military units dedicated to engineering functions seems to be a development of the 18th century. In the modern world, the largest military engineering unit is the United States Army Corps of Engineers (USACE).

The USACE is an engineer formation of the United States Army that has three primary mission areas: Engineer Regiment, military construction, and civil works. Founded 16 March 1802 the Corps was and still is responsible for much infrastructure in the USA which also makes it one of the world’s largest project management organizations. The formal training of military engineers appears to have been a French development (quickly copied by other countries), whereas the formation of a military engineering unit seems to have originated in the UK.  

UK Developments

Engineers have always served in the armies of the Crown with engineers leading the construction of castles and military fortifications for the time of William the Conqueror.  The Royal Engineers trace their origins back to the military engineers brought to England by William the Conqueror, specifically Bishop Gundulf to construct Rochester Castle between 1087 and 1089, and claim over 900 years of unbroken service to the crown.

The origins of the modern corps, along with those of the Royal Artillery, lie in the Board of Ordnance established in the 15th century. In 1716, the Board of Ordnance established a Corps of Engineers, consisting entirely of commissioned officers. Manual engineering works were done by Artificer Companies, made up of contracted civilian artisans and laborers.

This started to change in 1772 when a Soldier Artificer Company was established for service in Gibraltar, the first instance of non-commissioned military engineers. The value of this small disciplined force was recognized during the Great Siege of Gibraltar (discussed below), working with other elements of the military to build and repair fortifications. Subsequently, the idea of a permanent military engineering unit was adopted by the rest of the British Army in 1787.

In that year, the Corps of Engineers was granted the Royal prefix, and a Corps of Royal Military Artificers was formed, consisting of non-commissioned officers and privates, to be led by the Royal Engineers. Ten years later, the Gibraltar company (which had remained separate) was absorbed, and the rest is history. So, what led to the Great Siege of Gibraltar, that brought a small army unit to national prominence?

The Great Siege of Gibraltar

The Great Siege of Gibraltar was an unsuccessful attempt by Spain and France to capture Gibraltar from the British during the American Revolutionary War, and was the largest battle of that war! Capturing the British base at Gibraltar was one of Spain’s primary war aims. The siege started on 16 June 1779, when Spain entered the war on the side of France and as co-belligerents of the revolutionary United Colonies.

The small Gibraltar garrison under George Augustus Eliott was blockaded from June 1779 to 7th February 1783 when the Peace of Paris came into effect. At three years, seven months, and twelve days, it is the longest siege endured by the British Armed Forces. Sustaining the siege was made possible by three large convoys each roughly a year apart, and British success in several related naval battles.

As part of the political maneuvering associated with the peace talks in Paris, the French and Spanish decided on a final major assault to capture Gibraltar. On 13 September 1782 the Bourbon allies launched their great attack using:

  • 5,260 fighting men, both French and Spanish, aboard ten newly engineered ‘floating batteries’ with 138 to 212 heavy guns each
  • In support were the combined Spanish and French fleet, which consisted of 49 ships of the line, 40 Spanish gunboats and 20 bomb-vessels, manned by a total of 30,000 sailors and marines, and
  • They were supported by 86 land guns and 35,000 Spanish and 7,000–8,000 French troops on land.

The assault was a total failure, but Gibraltar was still under siege.

The final ‘nail-in-the-coffin’ for the French and Spanish came when the third British relief convoy under Admiral Richard Howe slipped through their blockading fleet and arrived at the garrison on 18th October 1782. A total of 31 transport ships, delivered vital supplies, food, and ammunition. The fleet also brought an additional three regiments of foot, bringing the total number of the garrison to over 7,000. These defeats in October finally forced France and Spain to negotiate the terms of the Peace of Paris and end the wars. The British and Americans had already sorted out their part of the agreement so this British victory marked the last major engagement of the American Revolutionary War.

Holding the Rock had proved a formidable undertaking, and when the siege was finally lifted on 7th February 1783 the victory against overwhelming odds was greeted with great rejoicing in Great Britain.  But what led to the siege of Gibraltar and the French and Spanish support for the Americans – it’s a long and complex story?

War of Spanish Succession (1700 – 1714)

For convenience, the events that led to the siege can be said to have started with the death of the childless Habsburg King Charles II of Spain in 1700. The French Bourbon Monarchy sought to take over the Spanish crown by making the son of the current French King, the King of Spain, meaning the two crowns would merge when the young boy also became King of France. This triggered a war with Britain who was determined to stop France and Spain merging into a mega-power supported by the Hapsburg Empire. This war eventually ended in the 1713 & 15 Peace of Utrecht treaties, and the 1714 Treaties of Rastatt and Baden.

Under the agreements, Philip (a Bourbon) was confirmed as King of Spain in return for renouncing the right of himself or his descendants to inherit the French throne; the Spanish Empire remained largely intact, but ceded territories in Italy and the Low Countries to Austria and Savoy. Britain retained Gibraltar and Menorca which it captured during the war, acquired significant trade concessions in the Spanish Americas, and as a consequence, replaced the Dutch as the leading maritime and commercial European power.

The Seven Years’ War (1756–1763)

The Seven Years’ War was a continuation of the rivalry between Britain and the French / Spanish alliance. This war involved most of the major powers in Europe on one side or the other and was a global conflict fought in Europe, the Americas, and the Asia-Pacific regions.

The settlements that brought a end to this war involved no territorial changes in Europe but did involve transfer of colonial possessions between Great Britain, France, Portugal, and Spain:

  • France and Spain had to return conquered colonial territory to Great Britain and Portugal
  • France cedes its North American possessions east of the Mississippi River, Canada, the islands of St. Vincent, Tobago, Dominica, and Grenada, and some territory in India to Great Britain
  • France ceded Louisiana and its North American territory west of the Mississippi River to Spain
  • Spain ceded Florida to Great Britain.

The American Revolutionary War (1775 – 1783)

The American Revolutionary War offered the French and Spanish an opportunity to recover their losses from the Seven Years War. The French in particular, saw an independent America as good for France and bad for Britain.

From 1774, or earlier, American patriot forces were financed and supported by the Kingdom of France and, to a lesser extent, the Kingdom of Spain, and the Dutch Republic. After the American victory at the Battle of Saratoga the French could see the prospects of a long war, and possible American victory, and signed an alliance with America in 1778; shortly after, Britain declared war on France. Spain joined in 1779, and the Dutch in 1780, but as a ‘neutral’ the Dutch had been supplying the Americans since 1774.

As well as fighting in North America, these countries also attacked British possessions in Europe (Gibraltar and Menorca), the Caribbean, and India, with one of the primary Spanish objectives being the re-capture of Gibraltar.

The Peace of Paris that ended the American Revolutionary War involved a series of treaties between Britain, the USA, France, Spain, and the Dutch (United Provinces). As a result:

  • The United States was recognised as an entity and its Norther border with Canada was agreed to be along the Great Lakes. In return Britain obtained a trade agreement with the USA.
  • The British and the Dutch more-or-less re-established the status quo.
  • Spain regained its lost territories in North America including Florida and the Gulf Coast plus Menorca in the Mediterranean, Britain retained Gibraltar
  • The French and British agreed:
    • British would retain Newfoundland and adjacent islands, except Saint Pierre and Miquelon.
    • In the West Indies, the British crown returns Saint Lucia to France and surrenders Tobago, the French crown returns Grenada, St. Vincent, Dominica, St. Christopher (St. Kitts), Nevis and Montserrat to Britain, and
    • To more-or-less re-established the status quo in Africa and India.

So, at the end of the war, Spain had a good outcome in the Americas, France was nearly bankrupt (which is seen by many as one of the causes of the French Revolution), the USA achieved independence, and the British held onto most of their emerging empire. A fairly good outcome until the next round or wars between Britain and France started in 1793.

Conclusion

How much influence the British Army had on the formation of the United States Army Corps of Engineers is uncertain. The French provided military engineers to the revolutionary army and the French military engineers have a similar range of responsibilities to the USACE. Whereas the British REs don’t have the wide-ranging civil responsibilities of their USA counterparts but both forces have similar military roles.

For more blogs and papers on engineering and construction history see: https://mosaicprojects.com.au/PMKI-ZSY-005.php#Bld

Measuring time

If you want to know who made clocks tick (and why they no longer do) you need our latest article, Measuring time.

This article looks and improvements in the devices used to track the time of day over the last 5000 years and how improvements in the devices used to measure time interacted with the development of calendars, and the appreciation of time both socially and in the management of projects.

Download Measuring time from: https://mosaicprojects.com.au/Mag_Articles/AA031_Measuring_time.pdf  

For more on the Origins of Numbers, Calendars and Calculations see: https://mosaicprojects.com.au/PMKI-ZSY-010.php#Overview

Shining the light towards low-carbon construction

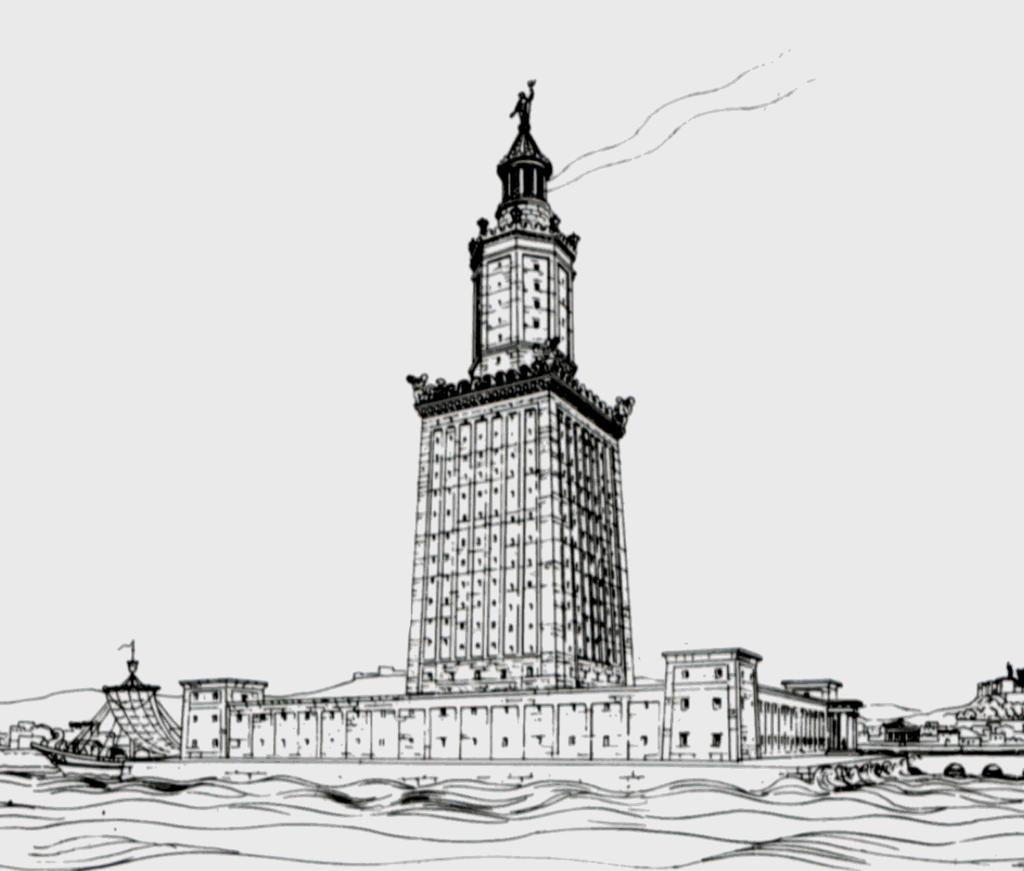
Two of the world’s longest serving lighthouses are closely related. The original lighthouse was the Pharos of Alexandria. This lighthouse was constructed in the third century BCE by Ptolemy 1st and is counted among the Seven Wonders of the Ancient World. The second is the ‘Tower of Hercules’. This is the oldest known working lighthouse. It has an Roman origin, built in the 1st century CE, on a peninsula about 2.4 km from the centre of A Coruña, Galicia, in north-western Spain. So, what’s the connection?

Pharos of Alexandria

Following his conquest of Egypt, Alexander the Great founded the city of Alexandria, in331 BCE, as his new capital, and a showplace linking Greek and Egyptian culture.  The presence of a natural harbor and a nearby supply of fresh water combined with an already existing colony of Macedonians made the selection of the site, an easy choice.

Alexandria was one of the world’s first planned cities. From its Gate of the Sun to its Gate of the Moon, temples and palaces lined its spacious streets. The city witnessed the romance of Julius Caesar and Cleopatra, the genius of the greatest mathematicians, and boasted the world’s first and probably greatest public library (see: The Great Library of Alexandria – The first Google?). The development of Alexandria into a centre of world trade continued under the Ptolemaic dynasty.

Pharos was a small island located off the coast of Alexandria. As part of the harbour development, Alexandria and Pharos were connected by a mole spanning more than 1,200 metres (0.75 miles), called the Heptastadion. The east side of the mole became the Great Harbour, and on the west side lay the Royal Harbour.  The Pharos was built at the extreme Western end of the island, marking shoals and the entrance to the harbour, by the architect Sostratus of Cnidus, a friend of the Ptolemaic kings. A second, shorter causeway ran from the end of the island to the rock on which the Pharos was built.

According to the sources, the 135-meter-high lighthouse was built between c. 300 – 280 BCE, during the reigns of Ptolemy I and II. The structure has three stages, all sloping slightly inward; the lowest was square, the next octagonal, and the top cylindrical. A broad spiral ramp led to the top, where a fire burned at night and for many years a mirror reflected sunlight during the day. The main building materials were blocks of limestone and granite.

How the fire was maintained during the lighthouse’s 17 centuries of operation is uncertain wood was always in short supply and expensive, oil or naphtha are possible alternatives. There appears to have been a cadre of trained operators, who lived in the Pharos and were responsible for the logistics and uninterrupted operation of the light as the rulers of Egypt changed from the Ptolemaic dynasty, to the Romans, to the Arabs. 

The lighthouse was severely damaged by three earthquakes between 956 and 1323 CE, eventually becoming an abandoned ruin. The Salten of Egypt converted base of the tower into a fort in 1480, reusing some of the stoned form the original construction.

The ‘Tower of Hercules’ – Spain

The Tower of Hercules is the oldest known working lighthouse. The tower was built in the 1st century CE, on a peninsula about 2.4 km from the centre of A Coruña, Galicia, in north-western Spain. It was built by the architect Gaius Sevius Lupus, from Aeminium in the province of Lusitania (present-day Coimbra, Portugal) using the original plans of the Pharos of Alexandria. The tower has been in constant use since the 2nd century CE and is considered to be the oldest extant lighthouse.

The original tower was shorter and wider than the one in the photograph by Alessio Damato. The original 34-metre (112 ft) Roman core was surrounded by a spiral ramp. Then in 1788, the tower core was given a neoclassical restoration, including a new 21-metre (69 ft) fourth story. This restoration was undertaken by naval engineer Eustaquio Giannini and was finished in 1791. His work protected the central core of the original Roman monument while restoring its technical functions.

Within, the much-repaired lighthouse, Roman and medieval masonry may be inspected, including a cornerstone with the inscription MARTI AVG.SACR C.SEVIVS LVPVS ARCHITECTVS ÆMINIENSIS LVSITANVS.EX.VO, identifying the architect and dedicating the structure to Mars, the Roman god of war.

Final thoughts

The longevity of both of these structures, and many of the more modern lighthouses built in the 18th century are a testament to the durability of a well-constructed stone structure.  In an age where minimizing the embedded carbon in structures is becoming increasingly important, should we be shifting back to durable stone in preference to concrete with its effective life-span measured in decades?

For more on the history of construction management see: https://mosaicprojects.com.au/PMKI-ZSY-005.php#Bld

Incentive contracts are not new

The idea of incentivizing a contractor to achieve the objectives specified in a contract are far from new. One example of this is the glazing of the Great East Window of York Minster in the early 15th century.

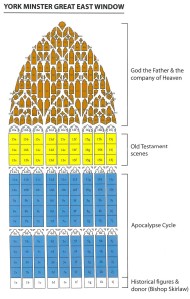
The cathedral was built between 1220 and 1472 on the site of an older Saxon cathedral. Its Great East Window was glazed between 1405 and 1408. The window is the largest medieval stained-glass window in UK at a bit over 9m wide x 23m tall (larger than tennis court), containing over 300 glazed panels. It was one of the most ambitious windows ever to have been made in the Middle Ages. The design contains two biblical cycles, Creation and Revelation, the beginning and the end of all things. Beneath the heavenly realm at the head of the window, populated by angels, prophets, patriarchs, apostles, saints, and martyrs, there are three rows of 27 Old Testament scenes from the Creation to the death of Absalom. Below this, scenes from the Apocalypse appears, with a row of historical figures at the base of the window. The complex narratives that the window explores represented a true collaboration of teams of clergy and craftsmen, combining advanced liturgical knowledge with the glass-painters’ genius.

Walter Skirlaw, bishop of Durham between 1330 and 1406, has been recognized as the donor of the Great East Window. Its creation was the work of celebrated Coventry glazier John Thornton. Little is known of Thornton’s career, but he was presumably a master glazier of some renown when he was awarded this major work at York Minster. Skirlaw had served as bishop of Coventry so it is likely he was at least in part responsible for bringing Thornton to York.

Neither the size or location of Thornton’s York workshop is known, but the glazing contract formed between him and the Chapter at York reveals that he alone was responsible for the design of the window and much of the key painted details. Analysis of the painting styles shows that there were several glass-painters at work on the window. Nonetheless, the window is characterized by the consistently high standard of painting exhibited across the whole window, demonstrating that Thornton selected his collaborators with great discernment and applied strict quality control.

The contract between Thornton and the Church to glaze the window, has a base price of £46 plus an incentive fee of £10 payable if the work was finished within 3 years.  The project was completed within the allowed time and Thornton received his full payment of £56 which is the equivalent of £375,000.00 in today’s money (US$450,000+).

The records held by York Minster show several ‘modern’ aspects of this contract:

  1. The project was the equivalent of a ‘design and construct’ contract
  2. Incentive fee payments were in use in the 15th century
  3. Quality was both important and controlled.

We don’t know how much interaction there was between the clergy and the glaziers, but it is likely for such an important commission, there were regular reviews of both the detail design before work on a panel started, and the completed panel before installation. 

On a closing note, Thornton’s fee contrasts significantly with the £11 million recently paid to the York Glaziers Trust to restore and clean the window.

For more on the history of construction management see: The evolution of construction management – Building Projects

Are numbers real?

Our article ‘Are Numbers Real?’, looking at the origins, and some of the irrational aspects, of the numbers we use every day has been updated and expanded. The focus of the article is the transition from Roman to Arabic number systems, briefly touching on earlier and later numbering systems.

Download the paper from: https://mosaicprojects.com.au/Mag_Articles/P008_Are_Numbers_Real.pdf

For more project management history see: https://mosaicprojects.com.au/PMKI-ZSY.php

The Great Library of Alexandria – The first Google?

The creation of an institution, designed to gather all of the information in the world and make it available to everyone who needs it pre-dates Google by 2200 years!

The city of Alexandria was founded by Alexander The Great in April 331 BCE after his army had captured the Egyptian Satrapy from the Persians. He wanted to build a large Greek city on Egypt’s coast with good fresh water and a harbour. Under his direction, Alexandria became the world’s first planned city with streets laid out in a grid and many other features still used in urban design.

Following the death of Alexander in 323 BCE, there was a power grab for his empire among his top-ranking officers and the Ptolemies gained control of Egypt, and made Alexandria their capital. They reigned as Pharaohs until Cleopatra’s death during the Roman era.  Within the city, the Great Library of Alexandria, was to become one of the largest and most significant libraries of the ancient world. Situated in the Royal Quarter near the harbour, it formed part of a larger research institution called the Mouseion, which was dedicated to the Muses, the nine goddesses of the arts. This was not the first library of its kind. A long tradition of libraries existed in both Greece and the ancient Near East. The earliest recorded archive of written materials comes from the Sumerian city-state of Uruk in around 3400 BCE, and there were other famous libraries in existence in Babylon and Greece. However, the Great Library would grow to outshine all of these.

The Great Library was most likely founded by Ptolemy I sometime before 283 BCE, but does not appear to have been completed until the reign of Ptolemy II (283–246 BCE). The Ptolemaic rulers intended the Great Library to be a collection of all knowledge, and worked for more than a century to expand the Library’s collections through an aggressive and well-funded policy of book purchasing, and plunder. Any books found on ships that came into port were taken to the library, where they were copied by official scribes. The original texts were kept in the library, and the copies delivered to the owners.

The Mouseion which housed the Great Library also served as home to a host of international scholars, poets, philosophers, and researchers, who the Ptolemies provided with a large salary, free food and lodging, and exemption from taxes. There were numerous classrooms, where the scholars were expected to at least occasionally teach students. The Roman period, particularly after the Christianization of the Empire in the 1st century CE, saw the decline and eventual destruction of this institution.   

While the concept of a library is debated, it is certainly more than just a collection of books – ‘any number of books brought together in one place, no more, of itself, constitutes a library than a pile of bricks can be called a house’. Academics generally agree a library needs purpose, organization, and maintenance of its collection (all of which apply to the Great Library), but the sheer size of the Great Library collection posed some unique problems.

First, within half a century of its foundation circa 295 BCE, the collections of the Royal Library had exceeded the space allotted to contain the accumulated books. To that end, Ptolemy III (246–221 BCE) established an offshoot that could house the surplus volumes in the newly built Serapeum, a temple dedicated to the worship of the Greco-Egyptian god Serapis, situated in the Egyptian district south of the city. Unlike the layout of the Mouseion, of which no records remain, a surprising amount of this temple has survived allowing us an insight as to how it looked and functioned.

This outer library was open to everyone and the medieval text of John Tzetzes suggests there were “42,000 books in this outer library”, mainly duplicates, and lower quality scrolls. There was free access to this collection, people of the city and visitors could take scrolls to read, or attend public readings if they were illiterate.   

Second, making information freely available is one thing, being able to find that information is altogether a more complex undertaking. In addition to the outer library, the inner (Royal) Library is said to have held another 400,000 mixed books, plus 90,000 unmixed books. But, how could scholars navigate this vast collection in order to use it in any sort of efficient way? Finding the information you needed requires a system.

The starting point was assigning texts to different rooms based on their subject matter. The first Librarian, Zenodotus made an inventory of the Library’s holdings, which he then organized into three major categories:

  • The first category included history books, edited and standardized literary works, and new works of Ptolemaic literature.
  • The second included holdings used for comparison and in the creation of the standardized works mentioned above. Included in this category were also letters and maps.
  • The third group comprised original writings in foreign languages, many of which had been translated into Greek, and which, in translation were included in the first group.

Within each of these divisions he then organized the works alphabetically by the first letter of the name of their author. This was one of the first uses of the principle of alphabetic organization. To maintain the collection, library staff then attached a small dangling tag to the end of each scroll, which contained information on each work’s author, title, and its subject, so that materials could be easily returned to the area in which they had been classified, but this also meant that library users did not have to unroll each scroll in order to see what it contained. This was the first recorded use of metadata, another landmark in library history.

Zenodotus’ methods overlaid an ordering principle on the entire collection of the Great Library which continues to be applied in libraries through to the current times. But, as the collection grew a more detailed structure was needed. This was implemented by Callimachus of Cyrene; he divided the collection into the main realms of literature as generally agreed at the time. Then within each of these divisions, he shelved all the authors in alphabetical order by the first letter of their name. This scheme is a classic taxonomy, Aristotle (384-322 BCE) is often credited as the first great taxonomist and his ideas may have been influential in the design of the system.

This approach took care of the shelving principle, but Callimachus went a step further. As a finding aid, he produced the pinakes, or “Tables of Persons Eminent in Every Branch of Learning Together with a List of Their Writings”. While the entire one hundred twenty scrolls of the pinakes have not survived to this day, the pieces of it that have survived show this was one of the first known documents that lists, identifies, and categorizes a library’s holdings. Within the pinakes, Callimachus listed works alphabetically by author and genre then added metadata in the form of a short biographical note on each author, which prefaced that author’s entry within his catalogue and sometimes a summary of the scroll’s contents.

How great was the influence of the Great Library of Alexandria on the development of knowledge is hard to define, it was probably significant. What we do know is the systems used to lay out the library, and classify the documents carry through to modern times and the next level of detail, indexing the contents of books did not occur until the 13th century CE.

The advantages and disadvantages of the free-form Google search over the structure of a well designed taxonomy, and an annotated catalogue are the search will look at ‘everything’, but the list of documents produced has had no vetting for quality, accuracy or relevance.  When managing knowledge, more is not necessarily better.  

For more on indexing and library classification system download Finding Information – The art of Indexing from: https://mosaicprojects.com.au/PMKI-ZSY-010.php#Process1

At a more practical level, Mosaic’s Project Management Knowledge Index (PMKI) is a taxonomy of project management papers and articles. The Taxonomy is available to download, use and adapt as well as the articles, papers and reference materials: https://mosaicprojects.com.au/PMKI.php

The evolution of design processes

For most of human history the primary way of communicating design information was through the use of models. For example, construction of Florence’s new cathedral, the Santa Maria del Fiore, was based on a 30-foot long scale model of the structure complete with details of the buildings finishes, decorations and dome.  Construction started in 1296 and by 1418 work had progressed to the point where construction of the massive dome was needed (how the dome was built will be the focus of a later blog). Fast forward 250 years to 1673, and Sir Christopher Wren had the great model of the new St Paul’s cathedral in London built at significant cost.

The models were not the only design process, drawings of floor plans and elevations were undoubtedly used as were architectural details and sections, traditional knowledge held by master masons, guilds and other institutions defined proportions and other structural norms, standard templates were used to cut stone, full size drawings, and/or models, were made for complex detail elements, and for significant features such as large Gothic windows the design would be traced out at full size on a floor and the stones cut to fit. There were multiple systems used in combination, but very little in the way of a standard approach to documenting a design.

This started to change in 1794 when the École Polytechnique opened in Paris. It was established by the National Convention as the École Centrale des Travaux Publics (“Central School of Public Works”) under the leadership of Lazare Carnot and Gaspard Monge. It took its present name in 1795. Originally under the direction of the Ministry of the Interior, its function was to provide its students with a well-rounded scientific education with a strong emphasis in mathematics, physics, and chemistry, to prepare them to enter one of the national institutes of public works, or the military, as engineers or technical specialist. This concept gradually spread world-wide.

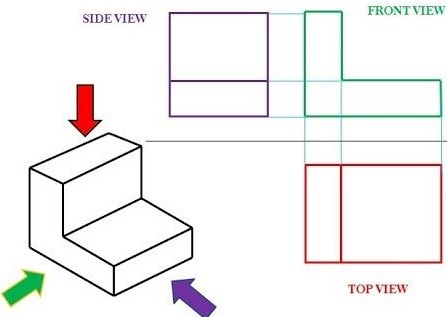
The second major advance was the formalization of orthographic projection, a part of the branch of mathematics called descriptive geometry. The book Géométrie descriptive (1798) by Gaspard Monge, a French mathematician, is regarded as the first to formalize orthographic projection. The concepts published by Monge facilitated the mass production of interchangeable parts required by the factories of the industrial revolution.

A design drawn using orthographic projection has 1:1 proportions on all views and dimensions that are not annotated can be scaled from the drawing accurately.  The problem is the drawings are not easy to read or understand without some training or explanation.

The economy offered by a drafting a set of drawings, that in most cases made the building of a model unnecessary, linked to the invention of the blueprinting process by John Herschel in 1842 accelerated the spread of technical drawing to most industries and created the role of draftsman.

For more on the History of Ancillary Project Management Concepts see: https://mosaicprojects.com.au/PMKI-ZSY-010.php

Or, for more on the History of Construction Management see: https://mosaicprojects.com.au/PMKI-ZSY-005.php#Process2 

Project Management – A Historical Timeline

Our latest paper, Project Management – A Historical Timeline has been published in the January edition of PM World Journal. Read the full journal free of charge at: https://pmworldjournal.com/

The objective of the historical timeline is to put the development of management, and project management capabilities into the wider flow of history for the period from 1000 CE to 2020 CE. This has been done by tabulating some of the significant events in history, with the advances in management thinking documented in our PM history papers, and a brief selection of important engineering and other achievements. The selection may be idiosyncratic but I’m happy to add other important events – just comment or (preferred) send an email with your ideas.

The intent of this exercise, to quote Joseph Priestley (1733 – 1804) is that a well-constructed timeline becomes “a most excellent mechanical help to the knowledge of history”, and may identify cross linkages that may be worth further research – history does not occur in isolation. Other coincidences may be simply interesting, for example Henri Fayol (France) and Henry Gantt (USA) both published significant books on the management of factories in 1916 while World War 1 was raging. 

The full paper (with updates) can be downloaded from: https://mosaicprojects.com.au/PDF_Papers/P212_Historical_Timeline.pdf

For more on the history of project management and its allied disciplines see: https://mosaicprojects.com.au/PMKI-ZSY.php

Bar Charts invented by Joseph Priestley in 1756

In a number of the papers that we’ve produced looking at the history of project controls, we have asserted the concept of a time scaled bar chart was the invention of Joseph Priestley in 1756. The information in this post tends to confirm this view.

The core element of a bar chart is a line of scaled length, where the length equates to its duration in relation to a date scale – the length of the bar represents it duration and the date scale places the bar in time. Priestley, uses this concept first in his Chart of Biography (1756) and then in his A New Chart of History (1769). Later, William Playfair incorporated and enhanced Priestley’s ideas in his ‘Commercial and Political Atlas’ of 1786.

The Chart of Biography (above) seems to be an original concept developed by Priestley to augment his teaching of history. It accurately registers the lives and deaths of two thousand famous men on a scale of three thousand years in “universal time”. The original chart is approximately 1 meter long and seems to be designed for review and reflection by students after a lecture. However, the concept of a ‘chart of history’ predates the work of Priestley.

One early example is the work of Francis Tallents, an English Minister and teacher from 1685:

Another is the work of Cartographer Thomas Jeffreys, from 1753:

Priestly also mentions an earlier French Chart, in the handbook that accompanied the New Chart of History, but without specific attribution – a digitized version of the 1777 version of handbook to accompany A New Chart of History can be downloaded from: https://mosaicprojects.com.au/PMKI-ZSY-020.php#Barchart Apart from improved accuracy the major differences between A New Chart of History (below) and the earlier charts above are the orientation, and consistency of the date scale between Priestley’s two charts, and improved use of notations and colours:

For more on these charts from a design perspective see A Design Journal – Research, Sketches & Projects of Patrick J. O’Donnel at: https://pjodonnel.wordpress.com/2015/11/02/design-history-joseph-priestley/

From a project controls perspective, Priestley’s comment on his Chart of Biography that “…a longer or a shorter space of time may be most commodiously and advantageously represented by a longer or a shorter line” and the use of ‘swim lanes’ to categorize information appears to neatly sum up the core essence of modern bar charts. 

For more on the history of bar charts and scheduling see: https://mosaicprojects.com.au/PMKI-ZSY-020.php#Barchart

The Evolution of Project Management – Final

Following publication of our initial thinking on the evolution of project management from earliest times to the present, a final paper has been uploaded to the Origins, and trends in, modern project management section of our website.  

This paper identified two waves of development in the sophistication of the management of projects, the first from pre-history through to the Romans (Western Empire), the second from the dark ages, through to the present.  Project control tools seem to have had little effect on this evolution until the start of the 20th century. 

Download The Evolution of Project Management