Monday

Tag Archives: CPM

Using WPM to augment CPM predictions

We all know (or should know) that when a project is running late, the predicted completion date calculated by the ‘critical path method’ (CPM) at an update tends to be optimistic, and this bias remains true for predictions based on simple time analysis as well as schedule calculations made using resource leveling.

There are two primary reasons for this:

  1. The assumption in CPM is that all future work will occur exactly as planned regardless of performance to date. The planned durations of future activities do not change.
  2. The burning of float has no effect of the calculated completion date until after the float is 100% consumed and the activity become critical.

For more on this issue see Why Critical Path Scheduling is Wildly Optimistic!

Having an optimistic schedule for the motivation of resources to perform in not all bad – the updated CPM schedule shows the minimum level of performance needed to stop the situation deteriorating. The problem is more senior managers also need a reliable prediction of when the project can realistically be expected to finish and CPM cannot provide this. A more realistic / pessimistic view is obtained by apply the principles of Work Performance Management (WPM) to a CPM schedule, using ‘activity days’ taken from the CPM schedule as the metric.

Our latest article, WPM Solves CPM Optimism, uses a simple CPM schedule to demonstrate the differences in the calculated project completion dates between CPM and WPM. The value of WPM is stripping away the optimism bias inherent in CPM scheduling (particularly early in the project), thereby providing management with a clear indication of where the project is likely to finish if work continues at the current levels of productivity. These predictions are not a statement of fact, change the productivity and you change the outcome! A similar approach can be used to assess projected completion dates based on a simple manual bar chart.

To download the article, and see more on augmenting CPM with WPM to enhance controls information: https://mosaicprojects.com.au/PMKI-SCH-041.php#WPM-CPM

CPM Scheduling – the logical way to error #2

A few weeks ago, we published some of the ways logical inconsistencies can be built into network logic (see the post here /2022/05/18/cpm-scheduling-the-logical-way-to-error-1/).  This post covers some more of the logic challenges from Section 3.5 of Easy CPM. For the most part, this type of problems will not show up in the automated checking tools applying test such as the DCMA 14 point assessment (see more on the DCMA assessment and schedule quality at: https://mosaicprojects.com.au/PMKI-SCH-020.php#Overview).

The naming convention is borrowed from Miklos Hajdu.  In all cases the links shown in the diagram are the controlling links, in a ‘live’ schedule there are likely to be many other links as well.

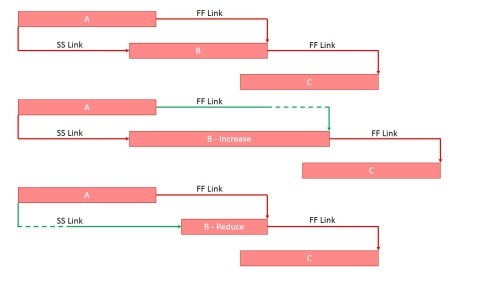
Increasing Normal Decreasing Neutral

An increase in activity B will delay completion, but a reduction has no effect. There are two variations on this type of construct.

A 1-day increase in the duration of activity B will increase the project duration by one day, however, reducing the length of activity B has no effect on the project’s duration.

Increasing Neutral Decreasing Reverse

An increase in activity B has no effect, but a reduction will delay completion. Again, there are two variations on this type of construct.

A 1-day increase in the duration of activity B has no effect on the project’s duration, however, reducing the length of activity B by 1-day will increase the project duration by one day.

Easy CPM, is designed for people who know how to drive scheduling tools and want to lift their skills to the next level. The book is available for preview, purchase (price $35), and immediate download, from:
https://mosaicprojects.com.au/shop-easy-cpm.php  

Critical Path Scheduling – 4 Things People Don’t Get

Over the last few weeks, I’ve seen more rubbish published about CPM from supposed experts than usual.  The false assertions range from statement claiming CPM does not include resource analysis to ones confusing basic resource scheduling processes.

So here are a few supported facts:

  1. The Critical Path Method (CPM), and PERT (Program Evaluation and Review Technique) both started out as ‘activity-on-arrow’ networks in 1957. The Precedence Diagramming Method (PDM) uses an activity-on-node’ notation, and was published in 1962 as a manual technique but was quickly applied to both PERT and CPM networks by the computer companies developing CPM and PERT software (by 1965 everything had merged into ‘all encompassing’ software packages). See: https://mosaicprojects.com.au/PMKI-ZSY-030.php
  2. The two fundamental differences between CPM and PERT are:
    1. CPM uses a single deterministic duration estimate, PERT uses three duration estimates and is used to assess the probability of achieving a milestone.
    2. CPM was built to resolve resourcing issues on plant shutdowns for Du Pont, PERT/Time did not include resources until the introduction of PERT/Cost in 1961. PERT/Cost used a single resource estimate. See: https://mosaicprojects.com.au/PMKI-ZSY-020.php#EVM
  3. Resource analysis uses time analysis calculations as a basis for its resource calculations:
    1. Aggregation: sums the resource requirements per day based on time analysis dates (usually early start)
    2. Smoothing: levels resource demand by using the available float. Some resource overloads will be reduced or eliminated by using float to shift non-critical activities back in time. The project end date and other constraints do not change, which means in some situations resource overloading may still occur.
    3. Leveling: delays critical tasks and the project completion to avoid overloading. See:
      https://mosaicprojects.com.au/PMKI-SCH-013.php#Process5

The ‘lean construction’ salesmen promoting the lie CPM does not include resources are simply wrong. What is true are a lot of schedulers develop schedules without resources, resource balancing in a CPM schedule is difficult, and there are now better options for resource optimization available in some tools. But many contracts and the USA GAO require resource loaded schedules.  Similarly, there are a number of ‘experts’ confusing resource smoothing and levelling (there seems to be quite a few). To correct their error, all they need to do is simply read a standard – the PMBOK® Guide (6th Ed.) is a good starting point and is consistent with all other credible authorities for the last 50+ years.

  • The purpose of a CPM schedule is also confused by many experts. Every schedule is a simple model of how work on a project may unfold in the future. This means the schedule cannot be completely accurate:
    • The schedule is a simplified representation, it contains a few hundred, or thousand activities that summarize the millions of actions that the project team will actually do to complete the work.
    • Every duration and resource estimate is an assessment of what may happen in the future. The unknown is the degree of error in each estimate, and overall.
    • The project team may, or may not, follow the planned sequence of work.

So, what’s the point of developing a schedule?  As Prof. George Box pointed out in “Time Series Analysis – Forecasting and Control” (page 285): “All models are approximations, and no model form can ever represent the truth absolutely. Given sufficient data, statistical tests can discredit models that could nevertheless be entirely adequate for the purpose at hand. Alternatively, tests can fail to indicate serious departures from assumptions because of small sample sizes or because these tests are insensitive to the types of discrepancies that occur. The best policy is to devise the most sensitive statistical procedures possible but be prepared to employ models that exhibit slight lack of fit. If diagnostic checks, which have been thoughtfully devised, are applied to a model fitted to a reasonably large body of data and fail to show serious discrepancies, then we should feel comfortable using that model.”  This and a number of similar quotes by him are often paraphrased as ‘All models are wrong, but some are useful’. A well-constructed CPM schedule can be extremely useful if it is used to:

  • Obtain agreement from the project team and resource suppliers on how the work will be done,
  • For assessing risk and identifying issues early,
  • Measuring performance against the plan and identifying variances,
  • Testing options to overcome negative variances and then obtaining buy-in to implement the recovery action.

But the CPM schedule will only be useful, if it is used by the project team to communicate, agree, and coordinate their work. The bigger the project, the more important this communication, agreement, and buy-in becomes. This is a dynamic, adaptive, agile, process. Focusing on what was thought to be a good idea last year embedded in a fossilized ‘contact program’ that does not change may keep claims consultants in a job, but it won’t help finish the project on time. If the schedule is not working on your project, it is a management and skills issue, changing to a different tool will not solve either of these factors.

One of my objectives in publishing Easy CPM was to make a low cost, easy-to-read resource available to schedulers who want to lift their skills – fixing management is a more interesting challenge. For more on Easy CPM see: https://mosaicprojects.com.au/shop-easy-cpm.php.

Finally, to answer the last question, borrowing from Group Captain Sir Douglas Bader: “Schedules are for the guidance of wise people and the obedience of fools!”  They provide insight, not control, and can be extremely useful if they are used!

CPM Scheduling – the logical way to error #1

Section 3.5 of Easy CPM looks at some of the logical scheduling errors that are easy to introduce into a schedule, and that for the most part will not show up in the automated checking tools applying test such as the DCMA 14 point assessment (see more on the DCMA assessment at: https://mosaicprojects.com.au/WhitePapers/WP1088_DCMA-14-Point.pdf)

The naming convention used below is borrowed from Miklos Hajdu.  In all cases the links shown in the diagram are the controlling links, in a ‘live’ schedule there are likely to be many other links as well.

Reverse Critical

In this logical configuration, the change in the overall project duration is the opposite of any change in the activity duration.

A reduction of 1-day in the duration of activity B will lengthen the project duration by one day, an increase of 1-day will reduce the project duration by one day.

Neutral Critical Open ends (dangles) have the effect of isolating the activity duration from the schedule. The project duration is unaffected by either a 1-day decrease, or a 1-day increase in the duration of activity B. There are two variants, SS and FF:

In both cases it does not matter what change is made to activity B, there is no change in the overall duration of the project.  This is one of the primary reasons almost every scheduling standard requires a link from a predecessor into the start of every activity and a link from the end of the activity to a successor, however, even with other links in place, if the control is through either of the scenarios above, the result is still the same.

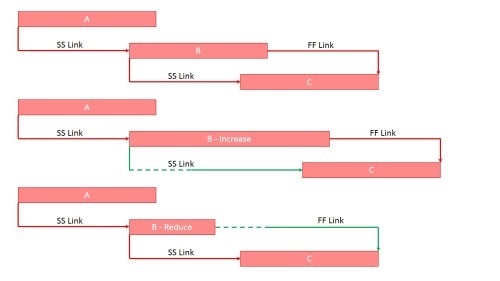
Bi-critical Activities

Finally, for this post, any change in the duration of activity B will cause the project duration to increase.

A 1-day reduction of the duration of activity B will lengthen the project duration by one day, and an increase of 1-day will also lengthen the project duration by one day.  Bi-critical activities depend on having a balanced ladder where all of the links and activities are critical in the baseline schedule. Increasing the duration of B pushes the completion of C through the FF link. Reducing the duration of B pulls the SS link back to a later time and therefore delays the start of C.  The same effect will occur if the ladder is unbalanced or there is some float across the whole ladder, it is just not as obvious and may not flow through to a delay depending on the float values and the extent of the change.

Easy CPM

There are more examples of similar logical inconsistencies included in Section 3.5 of Easy CPM. Easy CPM is designed for schedulers that know how to operate the tools efficiently, and are looking to lift their skills to the next level. The book is available for preview, purchase (price $35), and immediate download, from: https://mosaicprojects.com.au/shop-easy-cpm.php  

The origins of PERT and CPM – What came before the computers!

The development of PERT and CPM as Mainframe software systems starting in 1957 is well documented with contemporary accounts from the key people involved readily available.  What is less clear is how two systems developed contemporaneously, but in isolation, as well as a number of less well documented similar systems developed in the same timeframe in the UK and Europe came to have so many similar features.  These early tools used the ‘activity-on-arrow’ (AoA or ADM) notation which is a far from obvious model.  Later iterations of the concept of CPM used the ‘precedence’ notation which evolved from the way flow-charts were and are drawn.

One obvious connection between the early developments was the community of interest around Operation (or Operational) Research (OR) a concept developed by the British at the beginning of WW2.  OR had developed to include the concept of linear programming by the mid-1950s which is the mathematical underpinning of CPM, but while this link explains some of the cross pollination of ideas and the mathematics it does not explain terms such as ‘float’ and the AoA notation (for more on the development of CPM as a computer based tool see http://www.mosaicprojects.com.au/PDF_Papers/P042_History%20of%20Scheduing.pdf).

A recent email from Chris Fostel, an Engineering Planning Analyst with Northrop Grumman Corporation (CFostel@rcn.com) appears to offer a rational explanation.  I’ve reproduced Chris’ email pretty much verbatim below – the challenge posed to you is to see if the oral history laid out below can be corroborated or validated.  I look forward to the responses.

Chris’ Oral History

I was told this story in 1978 by a retired quartermaster who founded his own company after the War to utilize his global contacts and planning skills.  Unfortunately the individual who told me this story passed away quite a few years ago and I’m not sure any of his compatriots are still alive either.  Regardless, I thought I should pass this along before I join them in the next life.  I do not wish to minimize the work of Kelly and Walker. They introduced critical path scheduling to the world and formalized the algorithms.  They did not develop or invent the technique.

The origin of critical path scheduling was the planning of the US Pacific Island hopping campaign during World War II.  The Quartermaster Corps coordinated orders to dozens if not hundreds of warships, troop ships and supply ships for each assault on a new island.  If any ships arrived early it would alert the Japanese of an imminent attack.  Surprise was critical to the success of the island hopping campaign.  The US did not have enough warships to fight off the much larger Japanese fleet until late in the war. Alerting the Japanese high command would allow the Japanese fleet to intercept and destroy the slow moving US troop ships before they had a chance to launch an attack. 

Initially the quartermasters drew up their plans on maps of the pacific islands, including current location and travel times of each ship involved.  The travel times were drawn as arrows on the map.  Significant events, personnel or supplies that traveled by air were shown as dashed lines hopping over the ship’s arrows.  The quartermasters would then calculate shortest and longest travel times to the destination for all ships involved in the assault. The plans became very complicated.  Many ships made intermediate stops at various islands to refuel or transfer cargo and personnel.  The goal was to have all ships arrive at the same time.  It didn’t take the quartermasters long to realize that a photograph of the planning maps would be a devastating intelligence lapse.  They started drawing the islands as identical bubbles with identification codes and no particular geographical order on the bubble and arrow charts. These were the first activity on arrow critical path charts; circa 1942. 

The only validation I can offer you is that by now you should realize that activity on arrow diagrams were intuitive as was the term ‘float.’  Float was the amount of time a particular ship could float at anchor before getting underway for the rendezvous.  Later when the US quartermasters introduced the technique to the British for planning the D-Day invasion the British changed float to “Slack”, to broaden the term to include air force and army units which did not float, but could ‘slack off’ for the designated period of time. 

You will not find a written, dated, account of this story by a quartermaster corps veteran.  Critical path scheduling was a military secret until declassification in 1956.  In typical fashion, the veterans of WWII did not write about their experiences during the War.  No one broke the military secrecy.  After 1956 they were free to pass the method on to corporate planners such as Kelly and Walker.  A living WWII Quartermaster veteran, should be able to provide more than my intuitive confirmation.

This narrative makes sense to me from a historical perspective (military planning has involved drawing arrows on maps for at least 200 years) and a timing perspective.  Can we find any additional evidence to back this up??  Over to you!

Critical confusion – when activities on the critical path don’t compute……

The definition of a schedule ‘critical path’ varies (see Defining the Critical Path), but the essence of all of the valid definitions is the ‘critical path’ determines the minimum time needed to complete the project and either by implication or overtly the definitions state that delaying an activity on the critical path will cause a delay to the completion of the project and accelerating an activity will (subject to float on other paths[1]) accelerate the completion of the project.

A series of blog posts by Miklos Hajdu, Research Fellow at Budapest University of Technology and Economics, published earlier this year highlights the error in this assumption and significantly enhances the basic information contained in my materials on ‘Links, Lags and Ladders’ and our current PMI-SP course notes.  The purpose of this post is to consolidate all these concepts into a single publication.

The best definition of a critical path is Critical Path: sequence of activities that determine the earliest possible completion date for the project or phase[2].  This definition is always correct.  Furthermore, in simple Precedence networks (PDM) that only use Finish-to-Start links, and traditional Activity-on-Arrow (ADM) networks the general assumption that increasing the duration of an activity on the critical path delays the completion of the schedule and reducing the duration of an activity on the critical path accelerates the completion of the schedule holds true.  The problems occur in PDM schedules using more sophisticated link types.  Miklos has defined five constructs using standard PDM links in which the normal assumption outlined above fails. These constructs, starting with the ‘normal critical’ that behaves as expected are shown diagrammatically below[3].

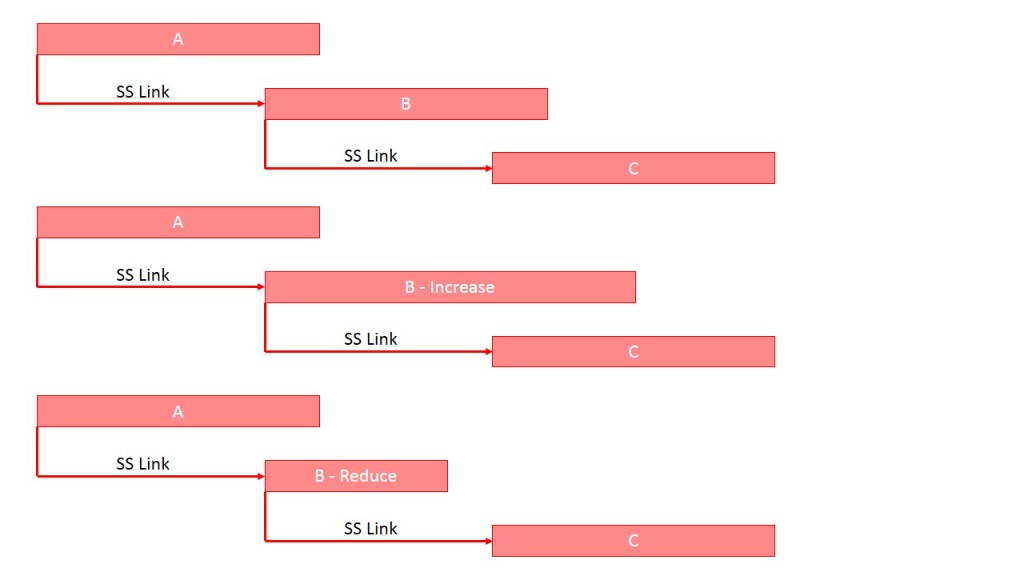
Normal Critical

The overall project duration responds as expected to a change in the activity duration.

A one day reduction of the duration of an activity on the critical path will shorten the project duration by one day, a one day increase will lengthen the project duration by one day.

Reverse Critical

The change in the overall project duration is the opposite of any change in the activity duration.

A one day reduction of the duration of Activity B will lengthen the project duration by one day, a one day increase will reduce the project duration by one day.

Neutral Critical

Either a day decrease or a day increase leaves the project duration unaffected. There are two variants, SS and FF:

In both cases it does not matter what change you make to Activity B, there is no change in the overall duration of the project.  This is one of the primary reasons almost every scheduling standard requires a link from a predecessor into the start of every activity and a link from the end of the activity to a successor.

Bi-critical Activities

Any change in the duration of Activity B will cause the project duration to increase.

A one day reduction of the duration of Activity B will lengthen the project duration by one day, a one day increase will lengthen the project duration by one day.  Bi-critical activities depend on having a balanced ladder where all of the links and activities are critical in the baseline schedule. Increasing the duration of B pushes the completion of C through the FF link.  Reducing the duration of B ‘pulls’ the SS link back to a later time and therefore delays the start of C.  The same effect will occur if the ladder is unbalanced or there is some float across the whole ladder, it is just not as obvious and may not flow through to a delay depending on the float values and the extent of the change.

Increasing Normal Decreasing Neutral

An increase in Activity B will delay completion, but a reduction has no effect! There are two variations on this type of construct.

A one day increase in the duration of Activity B will increase the project duration by one day, however, reducing the length of Activity B has no effect on the project’s duration.

Increasing Neutral Decreasing Reverse

An increase in Activity B has no effect, but a reduction will delay completion! Again, there are two variations on this type of construct.

A one day increase in the duration of Activity B has no effect on the project’s duration, however, reducing the length of Activity B by one day will increase the project duration by one day.

Why does this matter?

The concept of the schedule model accurately reflecting the work of the project to support decision making during the course of the work and for the forensic assessment of claims after the project has completed, is central to the concepts of modern project management.  Apart from the ‘normal critical’ construct, all of the other constructs outlined above will produce wrong information or allow a claim to be dismissed based on the nuances of the model rather than the real effect.

Using most contemporary tools, all the planner can do is be aware of the issues and avoid creating the constructs that cause issues.  Medium term, there is a need to revisit the whole function of overlapping activities in a PDM network to allow overlapping and progressive feed to function efficiently.  This problem was solved in some of the old ADM scheduling tools, ICL VME PERT had a sophisticated ‘ladder’ construct[4].  Similar capabilities are available in some modern scheduling tools that have the capability to model a ‘Continuous precedence relationship[5]’ or implement RD-CPM[6].


[1] For more on the effect of ‘float’ see: http://www.mosaicprojects.com.au/PDF/Schedule_Float.pdf

[2] From ISO 21500 Guide to Project Management,

[3] The calculations for these constructs are on Miklos’s blog at: https://www.linkedin.com/in/miklos-hajdu-a1418862

[4] For more on ‘Links, Lags and Ladders’ see: http://www.mosaicprojects.com.au/PDF/Links_Lags_Ladders.pdf

[5] For more on continuous relationships see:  http://www.sciencedirect.com/science/article/pii/S1877705815031811

[6] For more on RD-CPM see: http://www.mosaicprojects.com.au/WhitePapers/WP1035_RD-CPM.pdf

Scheduling Acronyms – use the correct terms!

Critical path scheduling has only been around for 60 years, is well documented by the originators of the discipline and central to the practice of project management. However, through ignorance, overt commercialism or laziness, far too many scheduling professionals continue to confuse the terms and degrade the practice.

If we can’t use the same correct term consistently for a function or process in scheduling why should anyone else take us seriously. The originators of the various concepts knew what they called each of the items discussed below, it is both professional and polite to respect their intentions and legacy.

CPM = Critical Path Method. (Also called CPA – Critical Path Analysis) This term emerged in the 1960s to describe the two variants of CPM, ADM and PDM. CPM uses a single deterministic duration estimate for each activity (or task) to calculate the schedule duration, activity start and finish dates, various floats and the ‘critical path’. CPM focuses on the activities.

ADM = Arrow Diagramming Method. Also called AOA (Activity on Arrow).  ADM was the first of the CPM techniques developed by Kelley and Walker in 1957.  This style of network diagramming has largely faded from use.

Activity-on-Arrow Diagram


PDM = Precedence Diagramming Method. Also called AON (Activity on Node).  PDM was the second of the CPM techniques developed by Dr. John Fondahl, and published in 1961.  PDM is the standard form of CPM networking used today.

Precedence diagram


PERT = Programme Evaluation Review Technique. PERT was developed by the US Navy in 1957 in parallel with CPM and used an identical ADM network.   PERT differentiates from CPM in several ways.  Its focus in on the probability of achieving an event (eg, the completion of a phase or activity), the expected duration of each activity is calculated from three time estimates using a ‘modified Beta distribution’ (optimistic, most likely and pessimistic).  The ‘PERT Critical Path’ is calculated using the ‘expected’ durations and very simplistic probability assessments can be made based on the variability in the three estimates (but only on a single path).  PERT calculations for the ‘expected’ durations can be applied to PDM networks but are only of value if all of the links are ‘Finish-to-Start’. PERT is simplistic and significantly less accurate than the modern Monte Carlo analysis. For more on this see: Understanding PERT.

Summary

Calling any deterministic CPM schedule a PERT Chart is simply wrong; PERT is defined by three time estimates! Using PERT when you could use Monte Carlo is stupid – the information generated is less accurate. And inventing new names for existing processes is confusing and damaging.

The three phases of project controls

The need to control projects (or bodies of work that we would call a project today) extends back thousands of years. Certainly the Ancient Greeks and Romans used contracts and contractors for many public works. This meant the contractors needed to manage the work within a predefined budget and an agreed timeframe.  However, what was done to control projects before the 19th century is unclear – ‘phase 0’.  But from the 1800’s onward there were three distinct phases in the control processes.

Phase 1 – reactive

The concept of using charts to show the intended sequence and timing of the work became firmly established in the 19th century and the modern bar chart was in use by the start of the 20th century. One of the best examples is from a German project in 1910, see: Schürch .  A few years later Henry Gantt started publishing his various charts.

From a controls perspective, these charts were static and reactive. The diagrams enabled management to see, in graphic form, how well work was progressing, and indicated when and where action would be necessary to keep the work on time. However, there is absolutely no documented evidence that any of these charts were ever used as predictive tools to determine schedule outcomes. To estimate the completion of a project, a revised chart had to be drawn based on the current knowledge of the work – a re-estimation process; however, there is no documentation to suggest even this occurred regularly. The focus seemed to be using ‘cheap labour’ to throw resources at the defined problem and get the work back onto program.

Costs management seems to have be little different; the reports of the Royal Commissioners to the English Parliament on the management of the ‘Great Exhibition’ of 1851 clearly show the accurate prediction of cost outcomes. Their 4th report predicted a profit of ₤173,000.  The 5th and final report defined the profit as ₤186,436.18s. 6d. However this forward estimation of cost outcomes does not seem to have transitioned to predicting time outcomes, and there is no real evidence as to how the final profit was ‘estimated’. (See Crystal Palace).

Phase 2 – empirical logic

Karol Adamiecki’s Harmonygraph (1896) introduced two useful concepts to the static views used in bar charts and the various forms of Gantt chart. In a Harmonygraph, the predecessors of each activity are listed at the top and the activities timing and duration are represented by vertical strips of paper pinned to a date scale. As the project changed, the strips could be re-pinned and an updated outcome assessed.

The first step towards a true predictive process to estimate schedule completion based on current performance was the development of PERT and CPM in the late 1950s.  Both used a logic based network to define the relationship between tasks, allowing the effect of the current status at ‘Time Now’ to be cascaded forward and a revised schedule completion calculated.  The problem with CPM and PERT is the remaining work is assumed to occur ‘as planned’ no consideration of actual performance is included in the standard methodology. It was necessary to undertake a complete rescheduling of the project to assess a ‘likely’ outcome.

Cost controls had been using a similar approach for a considerable period. Cost Variances could be included in the spreadsheets and cost reports and their aggregate effect demonstrated, but it was necessary to re-estimate future cost items to predict the likely cost outcome.

Phase 3 – predictive calculations

The first of the true predictive project controls processes was Earned Value (EV). EV was invented in the early 1960s and was formalised in the Cost Schedule Controls System Criteria issued by US DoD in December 1967.  EV uses predetermined performance measures and formula to predict the cost outcome of a project based on performance to date.  Unlike any of the earlier systems a core tenet of EV is to use the current project data to predict a probable cost outcome – the effect of performance efficiencies to date is transposed onto future work. Many and varied assessments of this approach have consistently demonstrated EV is the most reliable of the options for attempting to predict the likely final cost of a project.

Unfortunately EV in its original format was unable to translate its predictions of the final cost outcome (EAC) into time predictions.  On a plotted ‘S-Curve’ it was relatively easy to measure the time difference between when a certain value was planned to be earned and when it was earned (SV time) but the nature of an ‘S-Curve’ meant the current SVt had no relationship to the final time variance.  A similar but different issue made using SPI equally unreliable. The established doctrine was to ‘look to the schedule’ to determine time outcomes. But the schedules were either at ‘Phase 1’ or ‘Phase 2’ capability – not predictive.

A number of options were tried through the 1960s, 70s and 80s to develop a process that could accurately predict schedule completion based on progress to date. ‘Count the Squares’ and ‘Earned Time’ in various guises to name two.  Whilst these systems could provide reasonable information on where the project was at ‘time now’ and overcame some of the limitations in CPM to indicate issues sooner than standard CPM (eg, float burn hiding a lack of productivity), none had a true predictive capability.

The development of Earned Schedule resolved this problem.  Earned Schedule (ES) is a derivative of Earned Value, uses EV data and uses modified EV formula to create a set of ‘time’ information that mirrors EV’s ‘cost’ information to generate a predicted time outcome for the project. Since its release in 2003 studies have consistently shown ES to be as accurate in predicting schedule outcomes as EV is in predicting cost outcomes.  In many respects this is hardly surprising as the underlying data is the same for EV and ES and the ES formula are adaptations of the proven EV formula (see more on Earned Schedule).

Phase 4 – (the future) incorporating uncertainty

The future of the predictive aspects of project controls needs to focus on the underlying uncertainty of all future estimates (including EV and ES).  Monte Carlo and similar techniques need to become a standard addition to the EV and ES processes so the probability of achieving the forecast date can be added into the information used for project decision making. Techniques such as ‘Schedule Density‘ move project controls into the proactive management of uncertainty but again are rarely used.

Summary:

From the mid 1800s (and probably much earlier) projects and businesses were being managed against ‘plans’.  The plans could be used to identify problems that required management action, but they did not predict the consequential outcome of the progress being achieved.  Assessing a likely outcome required a re-estimation of the remaining work, which was certainly done for the cost outcome on projects such as the construction of the Crystal Palace.

The next stage of development was the use of preceding logic, prototyped by Karol Adamiecki’s Harmonygraph, and made effective by the development of CPM and PERT as dynamic computer algorithms in the late 1950s. However, the default assumption in these ‘tools’ was that all future work would proceed as planned. Re-scheduling was needed to change future activities based on learned experience.

The ability to apply a predictive assessment to determine cost outcomes was introduced through the Earned Value methodology, developed in the early 1960s and standardised in 1967.   However, it was not until 2003 that the limitations in ‘traditional EV’ related to time was finally resolved with the publication of ‘Earned Schedule’.

In the seminal paper defining ES, “Schedule is Different”, the concept of ES was defined as an extension of the graphical technique of schedule conversion (that had long been part of the EVM methodology). ES extended the simple ‘reactive statement’ of the difference between ‘time now’ and the date when PV = EV, by using ‘time’ based formula, derived from EV formula, to predict the expected time outcome for the project.

The Challenge

The question every project controller and project manager needs to take into the New Year is why are more then 90% of project run using 18th century reactive bar charting and the vast majority of the remainder run using 60 year old CPM based approaches, non of which offer any form of predictive assessment.  Don’t they want to know when the project is likely to finish?

It’s certainly important to understand where reactive management is needed to ‘fix problems’, but it is also important to understand the likely project outcome and its consequences so more strategic considerations can be brought into play.

Prediction is difficult (especially about the future) but it is the only way to understand what the likely outcome will be based on current performance, and therefore support value based decision making focused on changing the outcome when necessary.

I have not included dozens or references in this post, all of the papers are available at http://www.mosaicprojects.com.au/PM-History.html
Schedule Calculations – Old and New

The way CPM schedules were calculated in the 1970s and 80s (prior to the availability of low-cost PC scheduling tools) used a simplification designed to minimise error and speed up a tedious task.  Whilst some of us are old enough to have used this ‘manual’ technique on real schedules, everyone in the modern world recognises Day # 1 = Wednesday 1st October and a 3 day duration activity will work on Wednesday, Thursday and Friday to finish on the 3rd October and the fact 1 + 3 = 4 is simply an anomaly in the way integers and ‘elapsed time’ interact that has to be dealt with inside the computers computations to produce accurate date based bar charts and tabulations.

Unfortunately there has been a rash of postings on linked-in over the last week totally confusing everyone with their nonsense about CPM calculations.  This blog is designed to correct the message!

To overcome the problem of a 3 day activity starting on the 1st October finishing on the 3rd October, but  staring on day 1 and adding a duration of 3 gives you 1 + 3 = 4, the simplified manual calculations assumed the starting point was ‘day Zero’ 0 + 3 = 3!

However, the old manual calculations starting from day Zero have never been correct – the start day number for every activity in a schedule is always the day before it actually starts.  The end dates (day numbers / dates) are correct and the advantage of this option is it only requires one simple calculation per task for both the forward and back passes and the Free Float calculations are a simple subtraction.

EF = ES + Duration
LS = LF – Duration ….  Easy!!

This simplistic methodology was absolutely essential for manually calculating large PDM schedules. The ‘normal’ scheduling practice through to the mid 1980s when affordable PCs arrived – very few companies could afford the expense of mainframe scheduling tools and those that did wanted to make sure the data was correct before the computer run.

The accurate calculation used in all scheduling software, recognises that a 3 day activity starts at the beginning of day 1 and works on days 1, 2 and 3 to finish at the end of day 3 and its successor (assuming a FS0 link) starts at the beginning of day 4.  Unfortunately these ‘real’ calculations require much more complex calculations[1].

ES = 1, EF = (1 + 3) – 1 to get to the end of day 3.
The Zero duration link requires (EF 3 + 0) + 1 = the next activity ES is the start of day 4.

This approach more than doubles the amount of calculation effort and increases the opportunity for error and of course affects Free Float calculations as well.

Fortunately computer software is not prone to making calculation errors and runs these more complex sums 100% accurately to calculate the date activities start and end accurately when transposed onto a calendar. For more on the actual calculations see: http://www.mosaicprojects.com.au/PDF/Schedule_Calculations.pdf

Given no one has used manual calculations to determine a major schedule in the last 20 years (at least) the old simplistic manual approach is redundant and should be consigned to my area of interest, the history of project scheduling (see: http://www.mosaicprojects.com.au/PM-History.html).

[1] For a more complete discussion see the excellent paper by Ron Winters written in 2003 and entitled ‘How to Befuddle a College Professor’, which can be found at:  http://www.ronwinterconsulting.com/Befuddle.pdf

Assessing Delay and Disruption

In preparation for the IAMA National conference later this week I have just finished developing and updating a short series of papers focused on addressing schedule delay and disruption.

  • Assessing Delay and Disruption – an overview of the accepted methods of forensic schedule analysis [ view the paper ]
  • Prolongation, Disruption and Acceleration Costs – an overview of the options for calculating costs associated with approved delays and acceleration [ view the paper ]
  • The complexities around concurrent and parallel delays are discussed on Mosaic’s White Paper WP1064 Concurrent and Parallel Delays

Any comments are welcome.