Monday

Category Archives: Risk

The reference case for management reserves

Risk management and Earned Value practitioners, and a range of standards, advocate the inclusion of contingencies in the project baseline to compensate for defined risk events. The contingency may (should) include an appropriate allowance for variability in the estimates modelled using Monte Carlo or similar; these are the ‘known unknowns’.  They also advocate creating a management reserve that should be held outside of the project baseline, but within the overall budget to protect the performing organisation from the effects of ‘unknown unknowns’.  Following these guidelines, the components of a typical project budget are shown below.

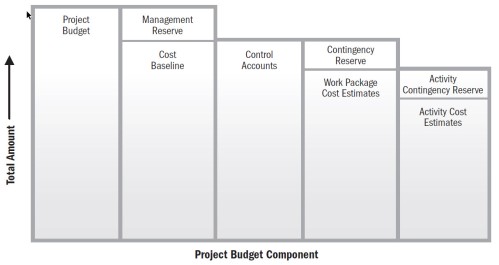
PMBOK® Guide Figure 7-8

The calculations of contingency reserves should be incorporated into an effective estimating process to determine an appropriate cost estimate for the project[1]. The application of appropriate tools and techniques supported by skilled judgement can arrive at a predictable cost estimate which in turn becomes the cost baseline once the project is approved. The included contingencies are held within the project and are accessed by the project management team through normal risk management processes. In summary, good cost estimating[2] is a well understood (if not always well executed) practice, that combines art and science, and includes the calculation of appropriate contingencies. Setting an appropriate management reserve is an altogether different problem.


Setting a realistic management reserve

Management reserves are an amount of money held outside of the project baseline to ‘protect the performing organisation’ against unexpected cost overruns. The reserves should be designed to compensate for two primary factors.  The first are genuine ‘black swans’ the other is estimating errors (including underestimating the levels of contingency needed).

The definition of a ‘black swan’ event is a significant unpredicted and unpredictable event[3].  In his book of the same name, N.N. Taleb defines ‘Black Swans’ as having three distinct characteristics: they are unexpected and unpredictable outliers, they have extreme impacts, and they appear obvious after they have happened. The primary defence against ‘black swans’ is organisational resilience rather than budget allowances but there is nothing wrong with including an allowance for these impacts.

Estimating errors leading to a low-cost baseline, on the other hand, are both normal and predictable; there are several different drivers for this phenomenon most innate to the human condition. The factors leading to the routine underestimating of costs and delivery times, and the over estimating of benefits to be realised, can be explained in terms of optimism bias and strategic misrepresentation.  The resulting inaccurate estimates of project costs, benefits, and other impacts are major source of uncertainty in project management – the occurrence is predictable and normal, the degree of error is the unknown variable leading to risk.

The way to manage this component of the management reserves is through the application of reference class forecasting which enhances the accuracy of the budget estimates by basing forecasts on actual performance in a reference class of comparable projects. This approach bypasses both optimism bias and strategic misrepresentation.

Reference class forecasting is based on theories of decision-making in situations of uncertainty and promises more accuracy in forecasts by taking an ‘outside view’ of the projects being estimated. Conventional estimating takes an ‘inside view’ based on the elements of the project being estimated – the project team assesses the elements that make up the project and determine a cost. This ‘inside’ process is essential, but on its own insufficient to achieve a realistic budget. The ‘outside’ view adds to the base estimate based on knowledge about the actual performance of a reference class of comparable projects and resolves to a percentage markup to be added to the estimated price to arrive at a realistic budget.  This addition should be used to assess the value of the project (with a corresponding discounting of benefits) during the selection/investment decision making processes[4], and logically should be held in management reserves.

Overcoming bias by simply hoping for an improvement in the estimating practice is not an effective strategy!  Prof. Bent Flyvbjerg’s 2006 paper ‘From Nobel Prize to Project Management: Getting Risks Right[5]’ looked at 70 years of data.  He found: Forecasts of cost, demand, and other impacts of planned projects have remained constantly and remarkably inaccurate for decades. No improvement in forecasting accuracy seems to have taken place, despite all claims of improved forecasting models, better data, etc.  For transportation infrastructure projects, inaccuracy in cost forecasts in constant prices is on average 44.7% for rail, 33.8% for bridges and tunnels, and 20.4% for roads.

The consistency of the error and the bias towards significant underestimating of costs (and a corresponding overestimate of benefits) suggest the root causes of the inaccuracies are psychological and political rather than technical – technical errors should average towards ‘zero’ (plusses balancing out minuses) and should improve over time as industry becomes more capable, whereas there is no imperative for psychological or political factors to change:

  • Psychological explanations can account for inaccuracy in terms of optimism bias; that is, a cognitive predisposition found with most people to judge future events in a more positive light than is warranted by actual experience[6].
  • Political factors can explain inaccuracy in terms of strategic misrepresentation. When forecasting the outcomes of projects, managers deliberately and strategically overestimate benefits and underestimate costs in order to increase the likelihood that their project will gain approval and funding either ahead of competitors in a portfolio assessment process or by avoiding being perceived as ‘too expensive’ in a public forum – this tendency particularly affects mega-projects such as bids for hosting Olympic Games.


Optimism Bias

Reference class forecasting was originally developed to compensate for the type of cognitive bias that Kahneman and Tversky found in their work on decision-making under uncertainty, which won Kahneman the 2002 Nobel Prize in economics[7]. They demonstrated that:

  • Errors of judgment are often systematic and predictable rather than random.
  • Many errors of judgment are shared by experts and laypeople alike.
  • The errors remain compelling even when one is fully aware of their nature.

Because awareness of a perceptual or cognitive bias does not by itself produce a more accurate perception of reality, any corrective process needs to allow for this.


Strategic Misrepresentation

When strategic misrepresentation is the main cause of inaccuracy, differences between estimated and actual costs and benefits are created by political and organisational pressures, typically to have a business case approved, or a project accepted, or to get on top of issues in the 24-hour news cycle.  The Grattan Institute (Australia) has reported that in the last 15 years Australian governments had spent $28 billion more than taxpayers had been led to expect. A key ‘political driver’ for these cost overruns was announcing the project (to feed the 24-hour news cycle) before the project team had properly assessed its costs.  While ‘only’ 32% of the projects were announced early, these accounted for 74% of the value of the cost overruns.

The Grattan Institute (Australia) has reported that in the last 15 years Australian governments had spent $28 billion more than taxpayers had been led to expect on transport infrastructure projects. One of the key ‘political drivers’ for these cost overruns was announcing the project (to feed the 24-hour news cycle) before the project team had properly assessed its costs.  While ‘only’ 32% of the projects were announced early, these projects accounted for 74% of the value of the cost overruns.

Reference class forecasting will still improve accuracy in these circumstances, but the managers and estimators may not be interested in this outcome because the inaccuracy is deliberate. Biased forecasts serve their strategic purpose and overrides their commitment to accuracy and truth; consequently the application of reference class forecasting needs strong support from the organisation’s overall governance functions.


Applying Reference Class Forecasting

Reference class forecasting does not try to forecast specific uncertain events that will affect a particular project, but instead places the project in a statistical distribution of outcomes from the class of reference projects.  For any particular project it requires the following three steps:

  1. Identification of a relevant reference class of past, similar projects. The reference class must be broad enough to be statistically meaningful, but narrow enough to be truly comparable with the specific project – good data is essential.
  2. Establishing a probability distribution for the selected reference class. This requires access to credible, empirical data for a sufficient number of projects within the reference class to make statistically meaningful conclusions.
  3. Comparing the specific project with the reference class distribution, in order to establish the most likely outcome for the specific project.

The UK government (Dept. of Treasury) were early users of reference class forecasting and continue its practice.  A study in 2002 by Mott MacDonald for Treasury found over the previous 20 years on government projects the average works duration was underestimated by 17%, CAPEX was underestimated by 47%, and OPEX was underestimated by 41%.  There was also a small shortfall in benefits realised.


This study fed into the updating of the Treasury’s ‘Green Book’ in 2003, which is still the standard reference in this area. The Treasury’s Supplementary Green Book Guidance: Optimism Bias[8] provides the recommended range of markups with a requirement for the ‘upper bound’ to be used in the first instance by project or program assessors.

These are very large markups to shift from an estimate to a likely cost and are related to the UK government’s estimating (ie, the client’s view), not the final contractors’ estimates – errors of this size would bankrupt most contractors.  However, Gartner and most other authorities routinely state project and programs overrun costs and time estimates (particularly internal projects and programs) and the reported ‘failure rates’ and overruns have remained relatively stable over extended periods.


Conclusion

Organisations can choose to treat each of their project failures as a ‘unique one-off’ occurrence (another manifestation of optimism bias) or learn from the past and develop their own framework for reference class forecasting. The markups don’t need to be included in the cost baseline (the project’s estimates are their estimates and they should attempt to deliver as promised); but they should be included in assessment process for approving projects and the management reserves held outside of the baseline to protect the organisation from the effects of both optimism bias and strategic misrepresentation.  As systems, and particularly business cases, improve the reference class adjustments should reduce but they are never likely to reduce to zero, optimism is an innate characteristic of most people and political pressures are a normal part of business.

If this post has sparked your interest, I recommend exploring the UK information to develop a process that works in your organisation: http://www.gov.uk/government/publications/the-green-book-appraisal-and-evaluation-in-central-governent

______________________

[1] For more on risk assessment see: http://www.mosaicprojects.com.au/WhitePapers/WP1015_Risk_Assessment.pdf

[2] For more on cost estimating see: http://www.mosaicprojects.com.au/WhitePapers/WP1051_Cost_Estimating.pdf

[3] For more on ‘black swans’ see: /2011/02/11/black-swan-risks/

[4] For more on portfolio management see: http://www.mosaicprojects.com.au/WhitePapers/WP1017_Portfolios.pdf

[5] Project Management Journal, August 2006.

[6] For more on the effects of bias see: http://www.mosaicprojects.com.au/WhitePapers/WP1069_Bias.pdf

[7] Kahneman, D. (1994). New challenges to the rationality assumption. Journal of Institutional and Theoretical
Economics, 150, 18–36.

[8] Green Book documents can be downloaded from: http://www.gov.uk/government/publications/the-green-book-appraisal-and-evaluation-in-central-governent

Risk management handbook published

The Risk Management Handbook edited by Dr. David Hillson (the ‘risk doctor’) is a practical guide to managing the multiple dimensions of risk in modern projects and business.  We contributed Chapter 10: Stakeholder risk management.

The 23 Chapters are a cutting-edge survey of the risk management landscape, providing a broad and up-to-date introduction to risk, with expert guidance on current best practice and cutting-edge insight into new developments within risk management.

For more on the book, see: www.koganpage.com/product/the-risk-management-handbook-9780749478827

The language used to define risks can contribute to failure.

If a risk is going to be adequately managed, it needs to be defined.  Failing to describe the actual risk (or risks) will almost inevitably lead to project failure and will frequently exacerbate the damage.

In recent times, there seems to be an explosion of documents in the public domain, including academic papers (where one would have hoped the reviewers and editors knew better) listing as ‘risks’ factors that cannot ever be risks.  The ‘fact’ hides the real or consequential risks that may be manageable.

Risk 101 – a risk is an uncertainty that may affect a project objective if it occurs. For something to be a risk, there has to be an uncertainty and the uncertainty may have a positive or negative impact on one or more objectives (see more on risk management). Risk management involves balancing the uncertainty, its potential impact and the cost and effort needed to change these for the better. But to do this you need to focus on the uncertainties that can be managed.

One of more frequently miss-described risks is ‘technical complexity’.  The degree of technical difficulty involved in a project is a FACT that can be measured and described!  Some projects such as launching a space rocket are technically complex, other less so; but NASA has a far higher success rate in its rocket launches than most IT departments have in developing successful software applications that achieve their objectives.  The technical difficulty may give rise to consequential risks that need addressing but these risks have to be identified and catalogued if they are going to be managed. Some of the risks potentially arising out of technical complexity include:

  • Inadequate supply of skilled resources in the marketplace / organisation;
  • Management failing to allow adequate time for design and testing;
  • Allowing technicians to ‘design in’ unnecessary complexity;
  • Management failing to provide appropriately skilled resources;
  • Management lacking the skills needed to properly estimate and manage the work;
  • Etc.

Another common risk in many of these pseudo risk lists is ‘lack of senior management support’.  This is a greyer area, the project team’s perception of management support and the actual level of support from senior management may differ. Developing an understanding of the actual attitude of key senior managers requires a methodical approach using tools such as the Stakeholder Circle.  However, even after defining the actual attitude of important senior managers the lack of precision in the risk description will often hide the real risks and their potential solutions or consequences:

  • If there is a real lack of senior management support the project should be cancelled, its probability of failure is greater than 80%. Continuing is simply wasting money.
  • If the problem is senior management failing to understand the importance of the project, this is an issue (it exists) and the solution is directed communication (see more on directed communication). The risk is that the directed communication effort will fail, leading to project failure, this risk needs careful monitoring.
  • If the problem is a project sponsor (or steering committee) who is not committed to project success and/or a sponsor (or steering committee) lacking understanding of his/her role (see more on the role of a sponsor) this is another issue with a solution based in education or replacement. Depending on the approach to resolving the issue (and its guaranteed impact on project success if the issue remains unresolved) the risk is either the necessary education process may not work and/or poor governance and senior management oversight will allow the issue to continue unresolved – these specific risks need to be explicitly described and acknowledged if they are to be managed.

The first step to managing risks effectively is developing a precise description of the actual risk that requires managing. If there are several associated risks, log each one separately and then group them under a general classification.   The description of each risk is best done using a common meta language such as:

  • ‘[Short name]: If a [description of risk] caused by [cause of risk] occurs, it may cause [consequence of occurrence]’. For example:
  • ‘Storms: If a heavy thunderstorm caused by summer heat occurs, it may cause flooding and consequential clean up’.

For each risk you need to:

  • Define the risk category and short name;
  • Describe the risk using an effective ‘risk meta language’;
  • Determine if the risk is an opportunity or threat and quantify its effect;
  • Prioritise the risk using qualitative assessment process;
  • Determine the optimum response;
  • Implement the response and measure its effectiveness (see more on risk assessment).

A simple Excel template such as this can help: http://www.mosaicprojects.com.au/Practical_Risk_Management.html#Tools

Managing issues is similar, the key difference is the consequences of an unresolved issue are certain – the issue is a fact that has to be dealt with (see more on issues management).

There are a number of factors that can cause both risks and issues to be improperly defined, some technical, most cultural. Three of the most important are:

  • Dealing with easy to identify symptoms without looking for the root cause of the risk / issue (see more on root cause analysis).
  • A management culture that does not allow open and honest reporting of risks and issues; preferring to hide behind amorphous descriptions such as ‘technical complexity’ rather than the real risk ‘management’s inability to manage this level of complicated technology’.
  • Failing to allow adequate time to analyse the stakeholder community using tools such as the as the Stakeholder Circle so that the full extent of risks associated with people’s capabilities and attitudes can be understood – these can account for up to 90% of the actual risks in most projects.

Management culture is the key to both allowing and expecting rigorous and honest assessment of risk. One of the key functions of every organisation’s governing body is to design, create and maintain the organisation’s management culture, this is a problem that starts at the top! For more on the roles of governance see: http://www.mosaicprojects.com.au/WhitePapers/WP1096_Six_Functions_Governance.pdf.

Project Risk Management – how reliable is old data?

One of the key underpinnings of risk management is reliable data to base probabilistic estimates of what may happen in the future.  The importance of understanding the reliability of the data being used is emphasised in PMBOK® Guide 11.3.2.3 Risk Data Quality Assessment and virtually every other risk standard.

One of the tenets underpinning risk management in all of its forms from gambling to insurance is the assumption that reliable data about the past is a good indicator of what will happen in the future – there’s no certainty in this processes but there is degree of probability that future outcomes will be similar to past outcomes if the circumstances are similar. ‘Punters’ know this from their ‘form guides’, insurance companies rely on this to calculate premiums and almost every prediction of some future outcome relies on an analogous interpretation of similar past events. Project estimating and risk management is no different.

Every time or cost estimate is based on an understanding of past events of a similar nature; in fact the element that differentiates an estimate from a guess is having a basis for the estimate! See:
–  Duration Estimating
–  Cost Estimating

The skill in estimating both normal activities and risk events is understanding the available data, and being able to adapt the historical information to the current circumstances. This adaptation requires understanding the differences in the work between the old and the current and the reliability and the stability of the information being used. Range estimates (three point estimates) can be used to frame this information and allow a probabilistic assessment of the event; alternatively a simple ‘allowance’ can be made. For example, in my home state we ‘know’ three weeks a year is lost to inclement weather if the work is exposed to the elements.  Similarly office based projects in the city ‘know’ they can largely ignore the risk of power outages – they are extremely rare occurrences. But how reliable is this ‘knowledge’ gained over decades and based on weather records dating back 180 years?

Last year was the hottest year on record (by a significant margin) as was 2014 – increasing global temperatures increase the number of extreme weather events of all types and exceptionally hot days place major strains on the electrical distribution grids increasing the likelihood of blackouts.  What we don’t know because there is no reliable data is the consequences.  The risk of people not being able to get to work, blackouts and inclement weather events are different – but we don’t know how different.

Dealing with this uncertainty requires a different approach to risk management and a careful assessment of your stakeholders. Ideally some additional contingencies will be added to projects and additional mitigation action taken such as backing up during the day as well as at night – electrical storms tend to be a late afternoon / evening event. But these cost time and money…..

Getting stakeholder by-in is more difficult:

  • A small but significant number of people (including some in senior roles) flatly refuse to accept there is a problem. Despite the science they believe based on ‘personal observations’ the climate is not changing…….
  • A much larger number will not sanction any action that costs money without a cast iron assessment based on valid data. But there is no valid data, the consequences can be predicted based on modelling but there are no ‘facts’ based on historical events……..
  • Most of the rest will agree some action is needed but require an expert assessment of the likely effect and the value proposition for creating contingencies and implementing mitigation activities.

If it ain’t broke, don’t fix it???? 

The challenge facing everyone in management is deciding what to do:

  • Do nothing and respond heroically if needed?
  • Think through the risks and potential responses to be prepared (but wait to see what actually occurs)??
  • Take proactive action and incur the costs, but never being sure if they are needed???

There is no ‘right answer’ to this conundrum, we certainly cannot provide a recommendation because we ‘don’t know’ either.  But at least we know we don’t know!

I would suggest discussing what you don’t know about the consequences of climate change on your organisation is a serious conversation that needs to be started within your team and your wider stakeholder community.

Doing nothing may feel like a good options – wait and see (ie, procrastination) can be very attractive to a whole range of innate biases. But can you afford to do nothing?  Hoping for the best is not a viable strategy, even if inertia in your stakeholder community is intense. This challenge is a real opportunity to display leadershipcommunication and  negotiation skills to facilitate a useful conversation.

Extreme Risk Taking is Genetic……

A recent 2014 scientific study, Going to Extremes – The Darwin Awards: sex differences in idiotic behaviour highlights the need for gender diversity.  The class of risk studied in this report is the idiotic risk, one that is defined as senseless risks, where the apparent payoff is negligible or non-existent, and the outcome is often extremely negative and often final. The results suggest that having an ‘all male’ or male dominated decision making group may be a source of risk in itself.

Sex differences in risk seeking behaviour, emergency hospital admissions, and mortality are well documented and confirm that males are more at risk than females. Whilst some of these differences may be attributable to cultural and socioeconomic factors (eg, males may be more likely to engage in contact and high risk sports, and are more likely to be employed in higher risk occupations), sex differences in risk seeking behaviour have been reported from an early age, raising questions about the extent to which these behaviours can be attributed purely to social and cultural differences. This study extends on these studies to look at ‘male idiot theory’ (MIT) based on the archives of the ‘Darwin Awards’. Its hypothesis derived from Women are from Venus, men are idiots (Andrews McMeel, 2011) is that many of the differences in risk seeking behaviour may be explained by the observation that men are idiots and idiots do stupid things…… but little is known about sex differences in idiotic risk taking behaviour.

The Darwin Awards are named in honour of Charles Darwin, and commemorate those who have improved the human gene pool by removing themselves from it in an idiotic way (note the photographs are both of unsuccessful attempts to win an award).  Whilst usually awarded posthumously, (the idiot normally has to kill themselves) the 2014 The Thing Ring award shows there are other options.  Based on this invaluable record of idiotic human behaviour, the study considered the gender of the award recipients over a 20 year period (1995-2014) and found a marked sex difference in Darwin Award winners: males are significantly more likely to receive the award than females.

Of the 413 Darwin Award nominations in the study period, 332 were independently verified and confirmed by the Darwin Awards Committee. Of these, 14 were shared by male and female nominees (usually overly adventurous couples in compromising positions – see: La Petite Mort) leaving 318 valid cases for statistical testing. Of these 318 cases, 282 Darwin Awards were awarded to males and just 36 awards given to females. Meaning 88.7% of the idiots accepted as Darwin Award winners were male!

Gender diversity on decision making bodies may help to reduce this potential risk factor in two ways.  First, by reducing the percentage of people potentially susceptible to MIT. Second, by modifying the social and cultural environment within decision making body, reducing the body’s tendency to take ‘extreme risk decisions’.

One well documented example is the current Federal Government. Given the extremely limited representation of women in the make-up of the current Abbott government, and some of the self-destructive decisions they have made, I’m wondering if there is a correlation. A softer, less aggressive, lower risk approach to implementing many of the policies they have failed to enact may have resulted in a very different outcome for the government.

Dealing with client delay

Preventing or minimising client induced delay is a common issue from small ‘agile’ IT developments through to multi-$billion mega projects.  Whilst this type of delay can never be completely eliminated, they can be reduced by applying a pragmatic six stage approach.


Stage 1:  Make sure your needs are known and understood by the client.

The best way to minimise delays is to ensure the client understands not only ‘what’ they are expected to contribute but also ‘why’ it is needed – don’t make the mistake of believing ‘they understand’, just because it is their project. Proactive communications is the key to helping your client better understand their role and the consequences of a delay on their part. Some of the questions you need to answer are:

  • Does the client understand the importance of their involvement?
  • Does the client really understand the need for timely feedback?
  • Do they appreciate the impact to the project if they are late / slow?
  • Do they know the dates that they will need to undertake actions so they can plan their work?

You will be surprised how valuable communicating proactively and raising visibility of the potential problems can be; the key is making sure the client develops an understanding of the requirements and the amount of effort needed for them to meet their obligations. This is a form of ‘directed communication’; see: The three types of stakeholder communication.

Stage 2:  Schedule the activity and code it up to make extracting focused reports easy.

A vital tool on the communication lexicon is clearly presented schedule information that is relevant to the client. Make sure their work is defied by activities that can be easily pulled into a focused report. Do not use lags on links to allow time for this work – no one is responsible for the ‘lag’.

Stage 3: Regularly status the schedule and communicate the changes to the client.

Having a plan is only part of the power of scheduling.  Create a baseline and show the slippage between any current ‘client owned’ activities and the plan. Using unbiased data to highlight issues will change behaviours – no one likes to be seen to be causing delays, particularly the project’s beneficiaries.

Stage 4: Raise a risk for anticipated future delays – manage the risk.

When you have a sense that the client is not going to meet their deadlines raise a risk and look for ways to manage the risk. If possible ask the client to help with the risk mitigation plan, which will give them some buy-in to help you be successful. This type of engagement also helps from a communication standpoint to better manage expectations. See more on risk management.

Stage 5: Raise an issue for an actual delay – manage the issue.

If the client ends up not meeting their dates, you have an issue that needs to be effectively managed. Issues management (problem identification and resolution) needs to be performed. Get your team, management, and stakeholders involved. Ask your manager for their input in resolving the problem that is now impacting your completion date. Get more accountability from your managers and the client’s managers to help resolve project deadline concerns. Your managers and sponsors are also the ones in a position to manage priorities to get the work done. If the problem cannot be resolved perfectly, at least you are continuing to manage expectations. See more on issue management.

Stage 6: Deal with contract issues contemporaneously.

If there is a need to make a contractual claim for the delay, make the claim immediately whilst the cause and effect are easily defined and keep the claim factual If the earlier steps in the process have been followed there will be no surprises and resolution of the issue can be achieved with the minimum of fuss or delay. See more on contractual dispute management.

Summary

Client induced delays are best avoided:

  • In commercial contracts, the ‘excusable delay’ (EOT) claim will inevitably damage the relationship and cause ill will – the effect of which can outweigh the benefits of the ‘claim’.
  • Internal projects don’t have the ‘claims’ option and may appear to be unreasonably held accountable for events and circumstances that are not within their control, but they do have control over the processes used to manage the project.

By utilising disciplined and proactive project management processes, you are more likely to avoid these problems and encourage the client to help you be successful by managing expectations and getting the client to be a part of the solution – not just the problem. It’s really just a case of applied stakeholder management!

Making Sense of Schedule Risk Analysis – Free Event

Mosaic Project Services is pleased to be supporting a free AIPM Project Controls SIG  (PC-SIG) meeting to be held at The Water Rat Hotel, 256 Moray Street, South Melbourne VIC, 3205: http://www.thewaterrathotel.com.au/

Date: Wednesday 20 November 2013,  Start 5.30 pm – Start (note earlier start time) Finish 7.00 pm –  There is no catering for the forum but interested participants are invited to pre and  post- forum drinks at the bar (after all it is a pub!!).

The agenda for the meeting is:

  • 17:30 Welcome to the AIPM SIG COP
  • 17:35 AIPM News – John Williams
  • 17:40 Project Controls Developments – Pat Weaver
  • 17:45 Presentation “Making Sense of Schedule Risk Analysis” – Tony Welsh
  • 18:45 Wrap up
  • 18:50 Close (after-meeting drinks/ dinner option)

The main presenter is Tony Welsh, President, Barbecana Inc. http://www.barbecana.com

Tony was one of the founders of Welcom (producer of Open Plan and Cobra) back in 1983.  He sold the company to Deltek in 2006 and has recently started a new company, Barbecana.

Tony grew up in South East London and holds degrees in physics from Oxford University and in operations research from the London School of Economics. His career began at Imperial Chemical Industries (ICI) under the direction of John Lawrence, a leading light in operations research (O.R.) and editor of the British O.R. Society journal. His work focused on sales forecasting, media scheduling, and measuring the affects of advertising.

Since 1980, Tony has been involved exclusively with project management software, for most of that time at the company he co-founded, Welcom. During that time he has been personally responsible for, among other things, the development of no less than four schedule risk analysis systems.

His paper will start with a brief discussion of the nature of uncertainty and how we measure it, the validity of subjective estimates, and why schedule uncertainty is different and more complex than cost uncertainty.  This will include an explanation of the phenomenon of merge bias.

It will go on to explain how Monte Carlo simulation works and why it is the only valid way to deal with schedule uncertainty.  Reference will be made specifically to uncertainty relating to task durations, resource costs, and project calendars.

The main part of the paper will deal with how to determine the input data, including correlations, and how to interpret the results, including estimated frequency function, cumulative frequency function, and percentile points.

The paper will conclude with a discussion of sensitivity analysis, its value, and the difficulty of doing it properly.

This event is a rare opportunity for Australian based project controls professionals in and around Melbourne to engage with one of the founders of the project controls profession, still active in developing and advancing our skills and knowledge.

To help manage numbers you are asked to register with AIPM at?  http://www.aipm.com.au/iMIS/Events/Event_Display.aspx?EventKey=VI131120&zbrandid=2139&zidType=CH&zid=5168408&zsubscriberId=505907810&zbdom=http://aipm.informz.net  (the event is free).  But as long as you don’t mind the risk of standing, pre-registration is not essential.

As the event sponsor, my hope is we have a really good turnout for the event and look forward to seeing you at The Water Rat – there’s plenty of street parking and the pub is on the #1 tram route.

The Schedule Compliance Risk Assessment Methodology (SCRAM)

SCRAM is an approach for identifying risks to compliance with the program schedule, it is the result of a collaborative effort between Adrian Pitman from the Australian Department of Defence, Angela Tuffley of RedBay Consulting in Australia, and Betsy Clark and Brad Clark of Software Metrics Inc. in the United States.

SCRAM focuses on schedule feasibility and root causes for slippage. It makes no judgment about whether or not a project is technically feasible. SCRAM can be used:

  • By organisations to construct a schedule that maximizes the likelihood of schedule compliance.
  • To ensure common risks are addressed before the project schedule is baselined at the commencement of a project.
  • To monitor project status, performed either ad hoc or to support appropriate milestone reviews
  • To evaluate challenged projects, to assess the likelihood of schedule compliance, root cause of schedule slippage and recommend remediation of project issues

Whilst the documentation is intensely bureaucratic, the concepts in SCRAM move beyond the concepts embedded in processes such as the DCMA 14 point checklist  to asking hard questions about the requirements of stakeholders and how effectively risk has been addressed before baselineing the schedule.

The SCRAM concept is freely available.  The SCRAM Process Reference Model (PRM) and a Process Assessment Model (PAM) documents are available for immediate download from: https://sites.google.com/site/scramsitenew/home

For more on schedule risk assessment and compliance assessment see: http://www.mosaicprojects.com.au/Planning.html#S-Risk

Be careful what you govern for!

Governance is an interesting and subtle process which is not helped by confusing governance with management or organisational maturity. A recent discussion in PM World Journal on the subject of governance and management highlighted an interesting issue that we have touched on in the past.

The Romans were undoubtedly good builders (see: The Roman Approach to Contract Risk Management). They also had effective governance and management processes, when a contractor was engaged to build something, they had a clear vision of what they wanted to accomplish; assigned responsibilities and accountability effectively; and failure had clearly understood, significant consequences.

Roman bridge builders were called pontiff. One of the quality control processes used to ensure the effective construction of bridges and other similar structures was to ensure the pontiffs were the first to cross their newly completed construction with their chariots to demonstrate that their product was safe.

An ancient Roman bridge

This governance focus on safety and sanctions created very strong bridges some of which survive in use to the present day but this governance policy also stymied innovation. Roman architecture and engineering practice did not change significantly in the last 400 years of the empire!

No sensible pontiff would risk his life to test an innovative approach to bridge design or construction when the governance systems he operated under focus on avoiding failure. Or in more general terms; the management response to a governance regime focused on ‘no failure’ backed up by the application of sanctions is to implement rigid processes. The problem is rigid process prevents improvement.

To realise the significance of this consider the technology in use in the 17th century compared to the modern day – the vast majority of the innovations that have resulted in today’s improved living standards are the result of learning from failure (see: How to Suffer Successfully).

But the solution is not that simple, we know that well designed and implemented, processes are definitely advantageous. There is a significant body of research that shows implementing methodologies and processes using CMMI, OPM3, PRINCE2, P3M3 and other similar frameworks has a major impact on improving organisational performance and outcomes.

However, organisational maturity is a similar ‘two edged sword’ to rigid governance and management requirements. We know organisational maturity defined as the use of standardised processes and procedures creates significant benefits in terms of reduced error and increased effectiveness compared to laissez-faire / ad hoc systems with little or no standardisation. But these improvements can evolve to become an innovation-sapping straightjacket.

Too much standardisation creates processes paralysis and a focus on doing the process rather than achieving an outcome. In organisations that that have become fixated on ‘process’, it is common to see more and more process introduced to over come the problem of process paralysis which in turn consume more valuable time and resources until Cohn’s Law is proved: The more time you spend in reporting on what you are doing, the less time you have to do anything. Stability is achieved when you spend all your time doing nothing but reporting on the nothing you are doing.

Avoiding this type of paralysis before a review is forced by a major crisis is a subtle, but critical, governance challenge. The governing body sets the moral and ethical ‘tone’ for the organisation, determines strategy and decides what is important. Executive Management’s role is to implement the governing body’s intentions, which includes determining the organisation’s approach to process and methodology, and middle and lower level management’s role is to implement these directives (for more on this see: Governance Systems & Management Systems). The governance challenge is working out a way to implement efficient systems that also encourage an appropriate degree of innovation and experimentation. The ultimate level in CMMI and OPM3 is ‘continuous improvement’. But improvement means change and change requires research, experimentation and risk taking. As Albert Einstein once said, “If we knew what it was we were doing, it would not be called research, would it?”

To stay with the Roman theme of this post: Finis origine pendet (quoting 1st century AD Roman poet and astronomer Marcus Manilius: The end depends upon the beginning). The challenge of effective governance is to encourage flexibility and innovation where this is appropriate (ie, to encourage the taking of appropriate risks to change and improve the organisation) whilst ensuring due process is followed when this is important. The challenge is knowing when each is appropriate and then disseminating this understanding throughout the organisation.

Organisations that follow the Roman approach to governance and avoid taking any form risk are doomed to fade into oblivion sooner or later.

_______________

Note: According to the usual interpretation, the term pontifex literally means “bridge-builder” (pons + facere). The position of bridge-builder was an important one in Rome, where the major bridges were over the Tiber, the sacred river (and a deity). Only prestigious authorities with sacral functions could be allowed to ‘disturb’ it with mechanical additions.

However, the term was always understood in its symbolic sense as well: the pontifices were the ones who smoothed the ‘bridge’ between gods and men. In ancient Rome, the Pontifex Maximus (Latin, literally: greatest pontiff) was the high priest of the College of Pontiffs (Collegium Pontificum), the most important religious role in the republic. The word pontifex later became a term used for bishops in the early Catholic Church and the Bishop of Rome, the Pope, the highest of bridge-builders sumus pontiff.

What’s the Probability??

The solution to this question is simple but complex….

There is a 1 in 10 chance the ‘Go Live’ date will be delayed by Project 1
There is a 1 in 10 chance the ‘Go Live’ date will be delayed by Project 2
There is a 2 in 10 chance the ‘Go Live’ date will be delayed by Project 3

What is the probability of going live on March 1st?

To understand this problem let’s look at the role of dice:

If role the dice and get a 1 the project is delayed, any other number it is on time or early.
If you role 1 dice, the probability is 1 in 6 it will land on 1 = 0.1666 or 16.66% therefore there is a 100 – 16.66 = 83.34% probability of success.

Similarly, if you roll 2 dice, there are 36 possible combinations, and the possibilities of losing are: 1:1, 1:2, 1:3, 1:4, 1:5, 1:6, 6:1, 5:1, 4:1, 3:1, 2:1. (11 possibilities)

The way this is calculated (in preference to using the graphic) is to take the number of ways a single die will NOT show a 1 when rolled (five) and multiply this by the number of ways the second die will NOT show a 1 when rolled. (Also five.) 5 x 5 = 25. Subtract this from the total number of ways two dice can appear (36) and we have our answer…eleven.
(source: http://www.edcollins.com/backgammon/diceprob.htm)

Therefore the probability of rolling a 1 and being late are 11/36 = 0.3055 or 30.55%, therefore the probability of success is 100 – 30.55 = 69.45% probability of being on time.

If we roll 3 dice we can extend the calculation above as follows:
The number of possible outcomes are 6 x 6 x 6 = 216
The number of ways not to show a 1 are 5 x 5 x 5 = 125

Meaning there are 216 combinations and there are 125 ways of NOT rolling a 1
leaving 216 – 125 = 91 possibilities of rolling a 1
(or you can do it the hard way: 1:1:1, 1:1:2, 1:1:3, etc.)

91/216 = 0.4213 or 42.13% probability of failure therefore there is a
100 – 42.13 = 57.87% probability of success.

So going back to the original problem:

Project 1 has a 1 in 10 chance of causing a delay
Project 2 has a 1 in 10 chance of causing a delay
Project 3 has a 1 in 5 chance of causing a delay

There are 10 x 10 x 5 = 500 possible outcomes and within this 9 x 9 x 4 = 324 ways of not being late. 500 – 324 leaves 176 ways of being late. 176/500 = 0.352 or a 35.2% probability of not making the ‘Go Live’ date.
Or a 100 – 35.2 = 64.8% probability of being on time.

The quicker way to calculate this is simply to multiply the probabilities together:

0.9 x 0.9 x 0.8 = 64.8%

These calculations have been added to our White Paper on Probability.